Introduction: Beyond the Average – The Critical Role of Variation in Medicine
In healthcare, the average often tells only half the story. Consider two physicians reviewing the recovery times for a new surgical technique. Dr. Smith’s patients have recovery times of 14, 15, 16, 15, and 15 days. Dr. Jones’s patients have recovery times of 2, 9, 16, 23, and 30 days. Both have an average recovery time of 15 days. However, the experiences of their patients—and the implications for clinical practice—are worlds apart.
This is where Standard Deviation becomes indispensable. Standard Deviation is a fundamental statistical measure that quantifies the amount of variation or dispersion in a set of data values. In the context of healthcare, it moves us beyond the simple average to answer a crucial question: How consistent or predictable are the outcomes, measurements, and responses we observe?
A low Standard Deviation indicates that data points tend to be close to the mean (average), suggesting consistency and predictability. A high Standard Deviation indicates that data points are spread out over a wider range, signaling volatility, unpredictability, or the presence of distinct subgroups. For healthcare professionals, administrators, and researchers, understanding this dispersion is not an academic exercise; it is a critical component of delivering high-quality, evidence-based care, ensuring patient safety, and managing resources effectively. This article explores how the calculated use of Standard Deviation transforms raw healthcare data into actionable clinical and operational insights.
Part 1: Understanding the Metric – What is Standard Deviation?
At its core, Standard Deviation (often denoted as σ for a population or s for a sample) measures the typical distance of each data point from the mean of the dataset.
1.1 The Calculation: A Step-by-Step Conceptual Walkthrough
While software handles the math, understanding the process is key to interpretation:
- Calculate the Mean (Average): Sum all values and divide by the number of values.
- Calculate the Deviation of Each Point: For each value, subtract the mean. This shows how far each point is from the average.
- Square the Deviations: This eliminates negative values and gives more weight to larger deviations.
- Find the Average of the Squared Deviations: This is the variance (σ² or s²).
- Take the Square Root: This returns the units to the original measurement (e.g., days, mg/dL, beats per minute), resulting in the Standard Deviation.
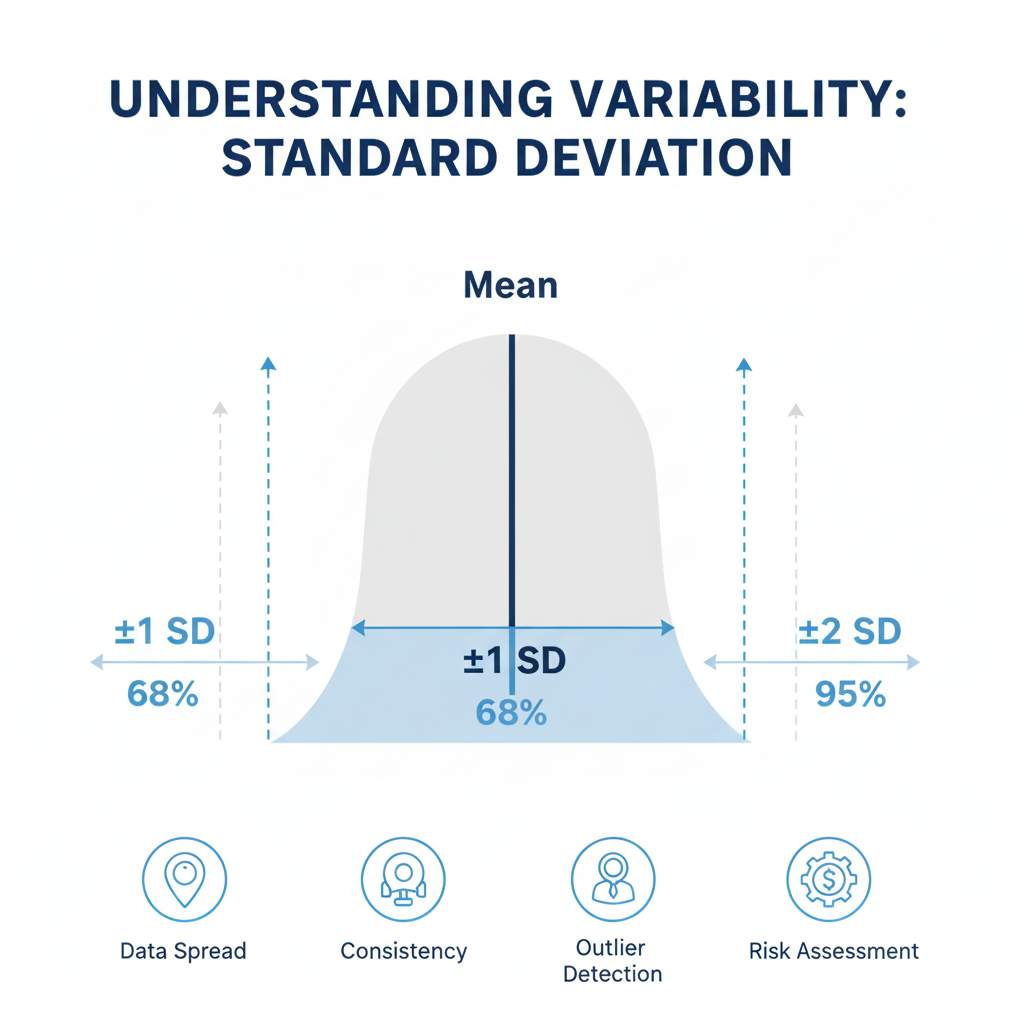
A small Standard Deviation means the data is clustered tightly around the mean. A large one means the data is spread out. In a normal distribution (the classic “bell curve”), approximately:
- 68% of data falls within ±1 Standard Deviation of the mean.
- 95% of data falls within ±2 Standard Deviations of the mean.
- 99.7% of data falls within ±3 Standard Deviations of the mean.
This property is the foundation for its powerful applications in healthcare.
Part 2: Clinical Applications – From Diagnosis to Treatment Monitoring
Standard Deviation is woven into the fabric of daily clinical decision-making, providing context to individual patient data.
2.1 Interpreting Laboratory Results and Vital Signs
Virtually every lab test and reference range is defined using Standard Deviation.
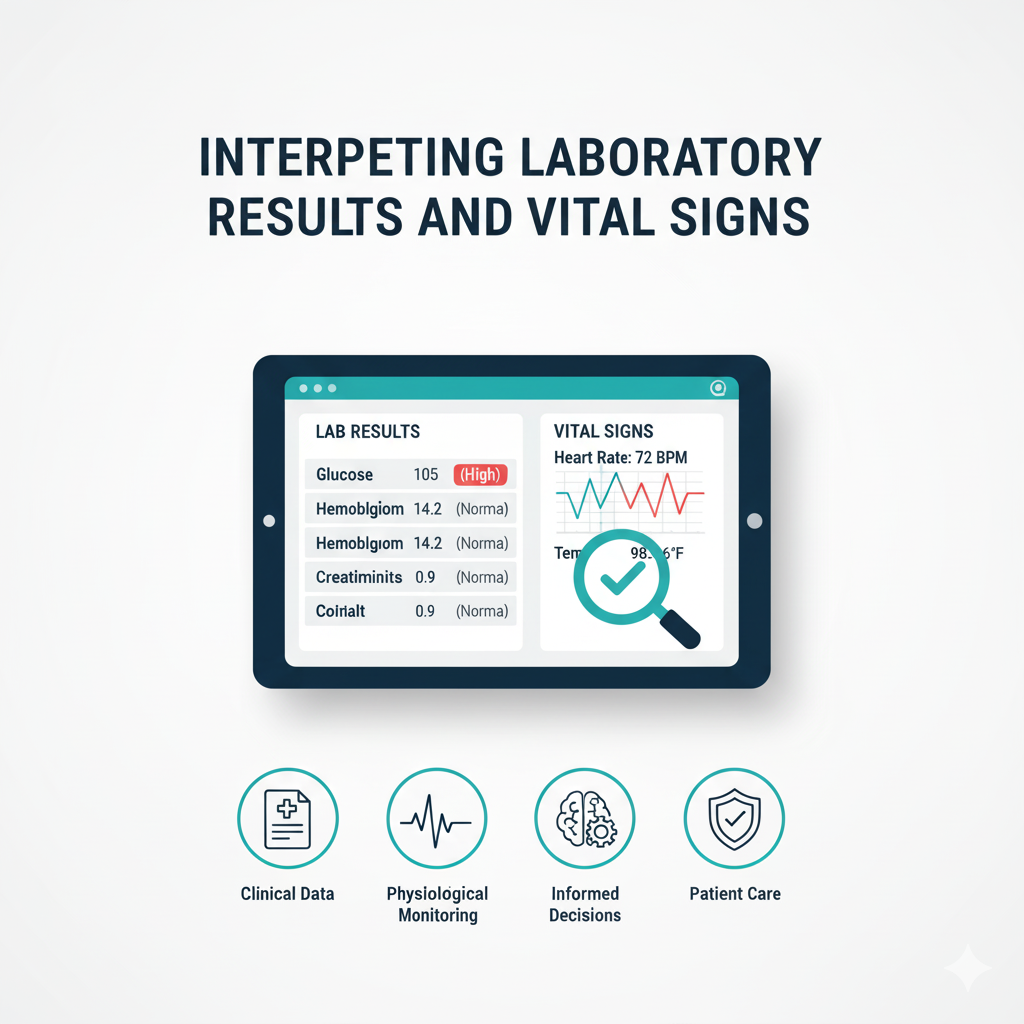
- Example – Blood-Based Labs: A patient’s hemoglobin A1c (HbA1c) result of 7.5% is meaningless without a reference range. Labs establish a “normal” range by testing a healthy population. The reference range is typically defined as the mean ± 2 Standard Deviations. If the mean HbA1c for healthy adults is 5.0% with a Standard Deviation of 0.5%, the normal range is 4.0% to 6.0%. A result of 7.5% is 5 Standard Deviations above the mean, strongly indicating diabetes. The Standard Deviation provides the scale for understanding the severity of the deviation.
- Example – Pediatric Growth Charts: These charts are a classic example of Standard Deviation in action. A child’s height and weight are plotted on curves that represent percentiles, which are derived from population means and Standard Deviations. A child falling below the 2nd percentile (approximately -2 Standard Deviations from the mean) for height may be flagged for potential failure to thrive, triggering further investigation.
2.2 Assessing Treatment Efficacy and Patient Stability
When monitoring a patient’s response to treatment, consistency is often as important as the average improvement.
- Case Study – Blood Pressure Management: Two antihypertensive drugs may both lower average systolic blood pressure by 15 mmHg. However, if Drug A has a low Standard Deviation in its effect (e.g., most patients experience a drop of 12-18 mmHg), while Drug B has a high Standard Deviation (e.g., responses range from a drop of 40 mmHg to an increase of 10 mmHg), Drug A is the more reliable and predictable choice. The high Standard Deviation for Drug B signals unpredictable effects, which could be dangerous for some patients.
- Inpatient Monitoring: In an ICU, a stable patient’s vital signs will have low Standard Deviation over a shift. A rising Standard Deviation in heart rate or blood pressure can be an early warning sign of clinical deterioration, even before the mean values change significantly, prompting pre-emptive intervention.
Part 3: Operational and Quality Improvement Insights
Beyond the bedside, Standard Deviation is a powerful tool for hospital administrators and quality improvement teams seeking to enhance efficiency and standardize care.
3.1 Analyzing Process Variation
Reducing unwanted variation is a core tenet of quality improvement methodologies like Six Sigma, which relies heavily on Standard Deviation.
- Example – Operating Room Turnover Time: A hospital aims to reduce turnover time (the time between one patient leaving the OR and the next entering). The mean turnover time might be 45 minutes. By calculating the Standard Deviation, they discover it is 30 minutes. This massive variation (e.g., times ranging from 15 to 105 minutes) disrupts surgical schedules, stresses staff, and dissatisfies patients. The improvement goal becomes not just lowering the mean, but drastically reducing the Standard Deviation, creating a more predictable and efficient process. Tracking the Standard Deviation over time measures their success in standardizing the process.
3.2 Resource Management and Forecasting
Hospitals can use Standard Deviation to better predict demand and allocate resources.
- Example – Patient Length of Stay (LOS): For a specific DRG (Diagnosis-Related Group), the average LOS might be 4 days. If the Standard Deviation is 0.5 days, bed managers can forecast capacity with high confidence. If the Standard Deviation is 3 days, forecasting becomes a gamble. This high variation leads to either bed shortages or costly empty beds. Analyzing the causes of this high Standard Deviation (e.g., specific complications, discharge delays) allows for targeted interventions to create more predictable patient flow.
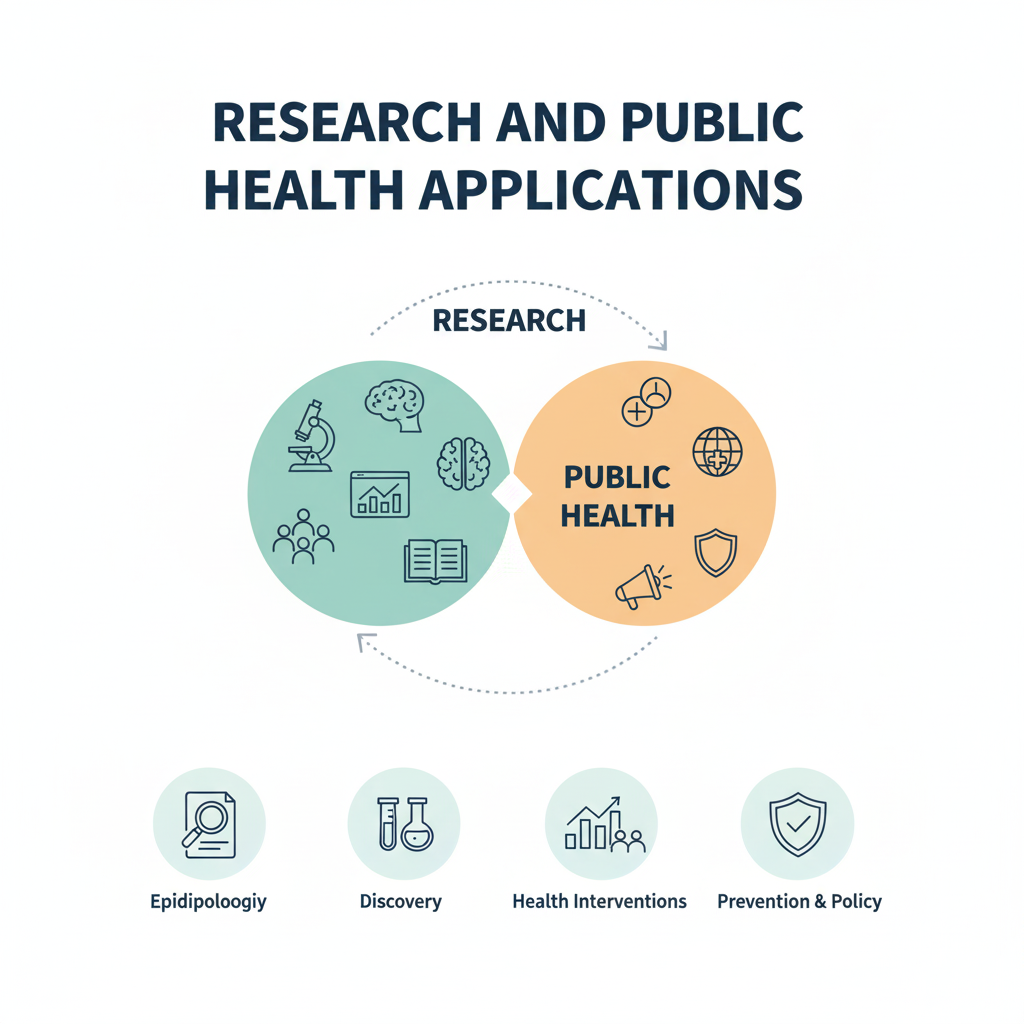
Part 4: Research and Public Health Applications
In clinical research and epidemiology, Standard Deviation is fundamental to determining the validity and significance of findings.
4.1 Evaluating Clinical Trials
Standard Deviation is crucial for interpreting the results of clinical trials and meta-analyses.
- Assessing Treatment Effect: In a trial comparing a new drug to a placebo, both groups will show a range of responses. The Standard Deviation is used to calculate metrics like the “standardized mean difference” (e.g., Cohen’s d), which expresses the difference between group means in terms of their pooled Standard Deviation. An effect size of 0.5 means the treatment group improved by half a Standard Deviation more than the control group, providing a scale-independent way to judge the intervention’s practical significance.
- Powering Studies: Researchers use Standard Deviation from pilot studies to perform power calculations. A smaller expected Standard Deviation means a smaller sample size is required to detect a true effect, making studies more feasible and ethical.
4.2 Public Health Surveillance and Epidemiology
When analyzing population health data, Standard Deviation helps identify unusual patterns and health disparities.
- Identifying Outbreaks: A sudden increase in the Standard Deviation of reported flu-like symptoms across a region might indicate the emergence of a new strain or an outbreak before the mean incidence rate skyrockets, enabling a faster public health response.
- Measuring Health Inequities: The Standard Deviation of health outcomes (e.g., life expectancy, infant mortality) across different zip codes or socioeconomic groups can be a powerful metric for quantifying health disparities. A large Standard Deviation indicates greater inequality, helping public health officials target resources to the most vulnerable communities.
Part 5: A Practical Walkthrough – Analyzing Blood Glucose Control
Let’s solidify these concepts with a detailed example: using Standard Deviation to manage diabetes.
Scenario: Two patients with Type 2 diabetes, Alex and Ben, have the same average daily blood glucose level of 150 mg/dL over a month. However, their glucose variability is very different.
Raw Data (Simplified):
- Alex’s Readings: 145, 148, 152, 149, 151, 150, 155, 146, 153, 147 (mg/dL)
- Ben’s Readings: 80, 120, 190, 100, 210, 140, 160, 90, 220, 110 (mg/dL)
Calculating Standard Deviation:
- Mean for both: 150 mg/dL.
- Standard Deviation for Alex: The values are all close to 150. The calculated Standard Deviation is low, approximately 3.5 mg/dL.
- Standard Deviation for Ben: The values are widely scattered. The calculated Standard Deviation is high, approximately 50.2 mg/dL.
Clinical Interpretation:
- Alex: With a low Standard Deviation, Alex’s blood sugar is stable and well-controlled. The therapy is predictable and effective.
- Ben: The high Standard Deviation indicates “glycemic variability,” a dangerous state. Even with a “good” average, the extreme highs (hyperglycemia) increase the risk for long-term complications, while the extreme lows (hypoglycemia) pose an immediate, acute danger.
Actionable Insight: Ben’s physician would not be reassured by the average of 150 mg/dL. The high Standard Deviation signals a need to investigate the cause—diet, medication timing, insulin sensitivity—and adjust the treatment plan to reduce variability, perhaps by switching to a different medication or using a continuous glucose monitor.
Part 6: Key Considerations and Best Practices
Using Standard Deviation effectively requires an understanding of its limitations and context.
6.1 When Standard Deviation Can Be Misleading
- Non-Normal Distributions: Standard Deviation is most informative with normally distributed (bell-shaped) data. For skewed data (e.g., hospital wait times, which are often skewed right with a few very long waits), the Standard Deviation can be inflated and less meaningful. In such cases, the Interquartile Range (IQR) is often a better measure of spread.
- Outliers: A single extreme outlier can dramatically increase the Standard Deviation, giving a false impression of high variability across the entire dataset. It’s always important to visualize the data (e.g., using a box plot) to check for outliers before relying on Standard Deviation.
6.2 Best Practices for Healthcare Professionals
- Always Report Mean ± Standard Deviation: When presenting data, never report the mean alone. “The average response was 15 units (± 3 units)” provides a complete picture of both the central tendency and the spread.
- Context is King: A Standard Deviation of 10 is large for a lab test with a reference range of 0-20, but small for a test with a range of 0-1000. Consider the Standard Deviation in relation to the mean and the clinical context.
- Use it for Comparison: The true power of Standard Deviation emerges when comparing the variability of different groups, processes, or time periods to identify which is more consistent and predictable.
Part 7: Advanced Analytical Frameworks for Clinical Data
Moving beyond foundational metrics, healthcare analytics employs sophisticated frameworks that integrate variability into predictive and diagnostic models. These frameworks transform raw data into strategic assets for clinical decision support.
Process Control and Quality Monitoring
Healthcare institutions implement statistical process control (SPC) charts as dynamic monitoring tools that incorporate variability measures:
- Control charts track patient outcomes over time with upper and lower control limits typically set at ±3 standard errors
- Run charts monitor process metrics with trend analysis and shift detection
- Funnel plots compare institutional performance against national benchmarks while accounting for expected variation
- Six Sigma methodologies define process capability indices that quantify how well clinical processes perform within specification limits
These tools help distinguish between common-cause variation (inherent to the process) and special-cause variation (indicating a fundamental change requiring investigation).
Risk Stratification and Predictive Modeling
Modern clinical analytics uses variability measures to enhance risk prediction:
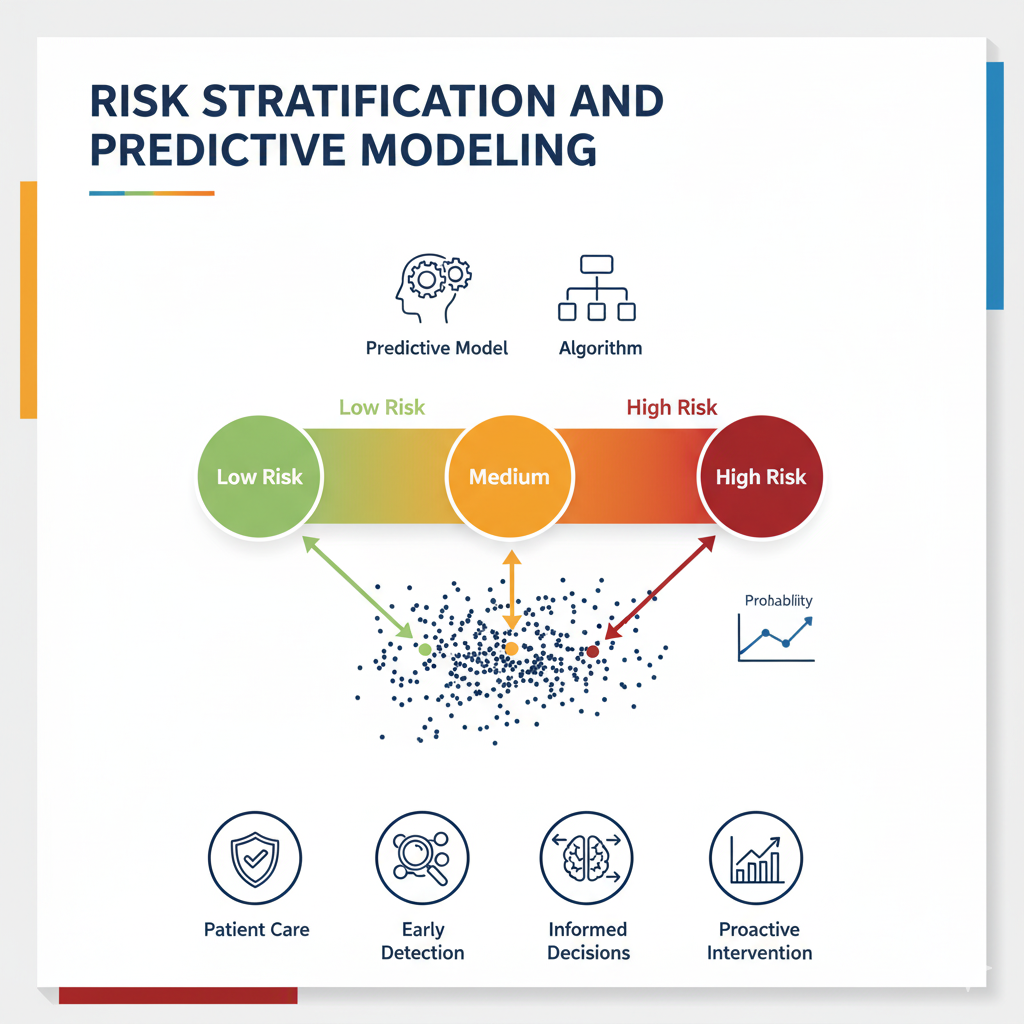
- Laboratory variability indices calculate within-patient test result fluctuations as independent risk predictors
- Vital sign instability scores incorporate heart rate and blood pressure variability to predict clinical deterioration
- Medication adherence metrics use prescription fill pattern consistency to identify patients needing intervention
- Chronic disease trajectories model biomarker fluctuations to predict exacerbations and complications
These approaches recognize that patterns of variability often carry more prognostic information than single measurements.
Part 8: Implementation Challenges in Healthcare Settings
Translating statistical concepts into clinical practice faces several significant barriers that require thoughtful navigation.
Data Quality and Integration Hurdles
Healthcare data presents unique challenges for variability analysis:
- Irregular measurement intervals create uneven time series that complicate variability calculations
- Multiple measurement devices introduce systematic variation across different clinical settings
- Documentation inconsistencies affect data completeness and reliability
- EHR system limitations often restrict access to raw data needed for sophisticated analysis
Addressing these issues requires data standardization protocols, device calibration programs, and clinical documentation improvement initiatives.
Interpretation and Clinical Workflow Integration
Even with perfect data, integrating variability metrics into clinical practice presents challenges:
- Alert fatigue from excessive flagging of statistical outliers
- Cognitive overload when presenting multiple metrics to busy clinicians
- Actionability uncertainty when variability is detected but clinical response is unclear
- Workflow disruption from incorporating new data elements into established processes
Successful implementations often use tiered alerting systems, embedded clinical decision support, and clear response protocols matched to specific variability patterns.
Part 9: Emerging Applications and Future Directions
The evolution of healthcare technology and analytics is creating new opportunities for leveraging variability analysis.
Digital Health and Continuous Monitoring
Wearable devices and remote patient monitoring are revolutionizing variability assessment:
- Continuous glucose monitoring provides rich variability data for diabetes management
- Ambulatory ECG monitoring captures heart rate variability patterns predictive of cardiac risk
- Home blood pressure monitoring identifies morning surge patterns and visit-to-visit variability
- Physical activity trackers monitor movement patterns for rehabilitation assessment
These technologies generate high-frequency data streams that enable more sensitive and personalized variability analysis.
Artificial Intelligence and Pattern Recognition
Machine learning approaches are advancing variability analysis in several ways:
- Deep learning models identify complex, non-linear patterns in clinical time series data
- Unsupervised learning clusters patient subtypes based on similar variability profiles
- Natural language processing extracts variability information from clinical narratives
- Computer vision algorithms analyze spatial variability in medical images for early disease detection
These techniques can identify subtle patterns that escape conventional statistical methods and human observation.
Precision Medicine and Personalized Reference Ranges
The future of variability analysis points toward increasingly personalized approaches:
- Individualized reference ranges based on personal baselines rather than population norms
- Longitudinal personal baselines that track an individual’s expected variability over time
- Context-aware alerts that consider situational factors affecting expected variability
- Dynamic risk assessment that updates probabilities based on real-time variability patterns
This paradigm shift from population-based to person-centered analytics promises more sensitive detection of clinically significant changes.
Part 10: Building an Organizational Culture of Data-Informed Practice
Sustaining the benefits of advanced analytics requires cultural and structural support within healthcare organizations.
Education and Clinical Engagement
Successful implementation depends on bridging the gap between analytics and clinical practice:
- Statistical literacy programs tailored for healthcare professionals
- Case-based learning using real clinical scenarios with variability data
- Multidisciplinary teams combining clinical, analytical, and operational expertise
- Clinical champions who can translate analytical insights into practice changes
These initiatives help create shared understanding and ownership of data-driven improvement efforts.
Governance and Infrastructure Requirements
Reliable variability analysis depends on supportive infrastructure and governance:
- Data governance frameworks ensuring quality, access, and appropriate use
- Analytical sandboxes for testing new variability metrics and algorithms
- Validation protocols for new analytical approaches before clinical implementation
- Performance monitoring of analytical systems to ensure ongoing accuracy
Establishing these structures creates the foundation for sustainable, trustworthy analytics.
Ethical Considerations and Appropriate Use
As analytical capabilities grow, healthcare organizations must address emerging ethical questions:
- Algorithmic transparency ensuring clinicians understand how variability metrics are calculated
- Bias mitigation preventing analytical approaches from disadvantaging specific patient groups
- Proportional response matching clinical interventions to the certainty and significance of findings
- Patient communication discussing variability findings in understandable, actionable terms
Navigating these considerations requires ongoing dialogue among clinicians, analysts, patients, and ethicists.
By addressing these broader dimensions, healthcare organizations can move beyond simply calculating metrics to embedding sophisticated variability analysis into their clinical DNA. The most successful implementations combine technical sophistication with clinical relevance, organizational support, and ethical grounding—transforming statistical concepts into tangible improvements in patient care and outcomes.
Conclusion: Embracing Variation for Superior Healthcare
The journey from raw data to profound insight in healthcare is paved with an understanding of variation. Standard Deviation is the key that unlocks this understanding. It transforms a solitary average into a story of consistency, risk, and predictability. It empowers clinicians to see beyond a single lab value to a pattern of stability or chaos. It enables hospital leaders to distinguish between efficient processes and chaotic ones. It provides researchers with the scale to measure true effect and public health officials with the lens to spot disparity.
Ultimately, mastering the use of Standard Deviation is not just about statistical literacy; it is about cultivating a mindset that seeks to understand and reduce unwanted variation. In a field where lives are on the line, this commitment to deeper insight leads to safer, more effective, and more personalized patient care. By consistently asking, “What does the Standard Deviation tell us?” healthcare professionals at every level can make more informed, data-driven decisions that improve outcomes for both individual patients and the populations they serve.