Dive deep into Unsupervised Learning with our definitive guide. Explore clustering, dimensionality reduction, and association rules. Master algorithms like K-Means, PCA, and Apriori to discover hidden patterns in your data.
What is Unsupervised Learning?
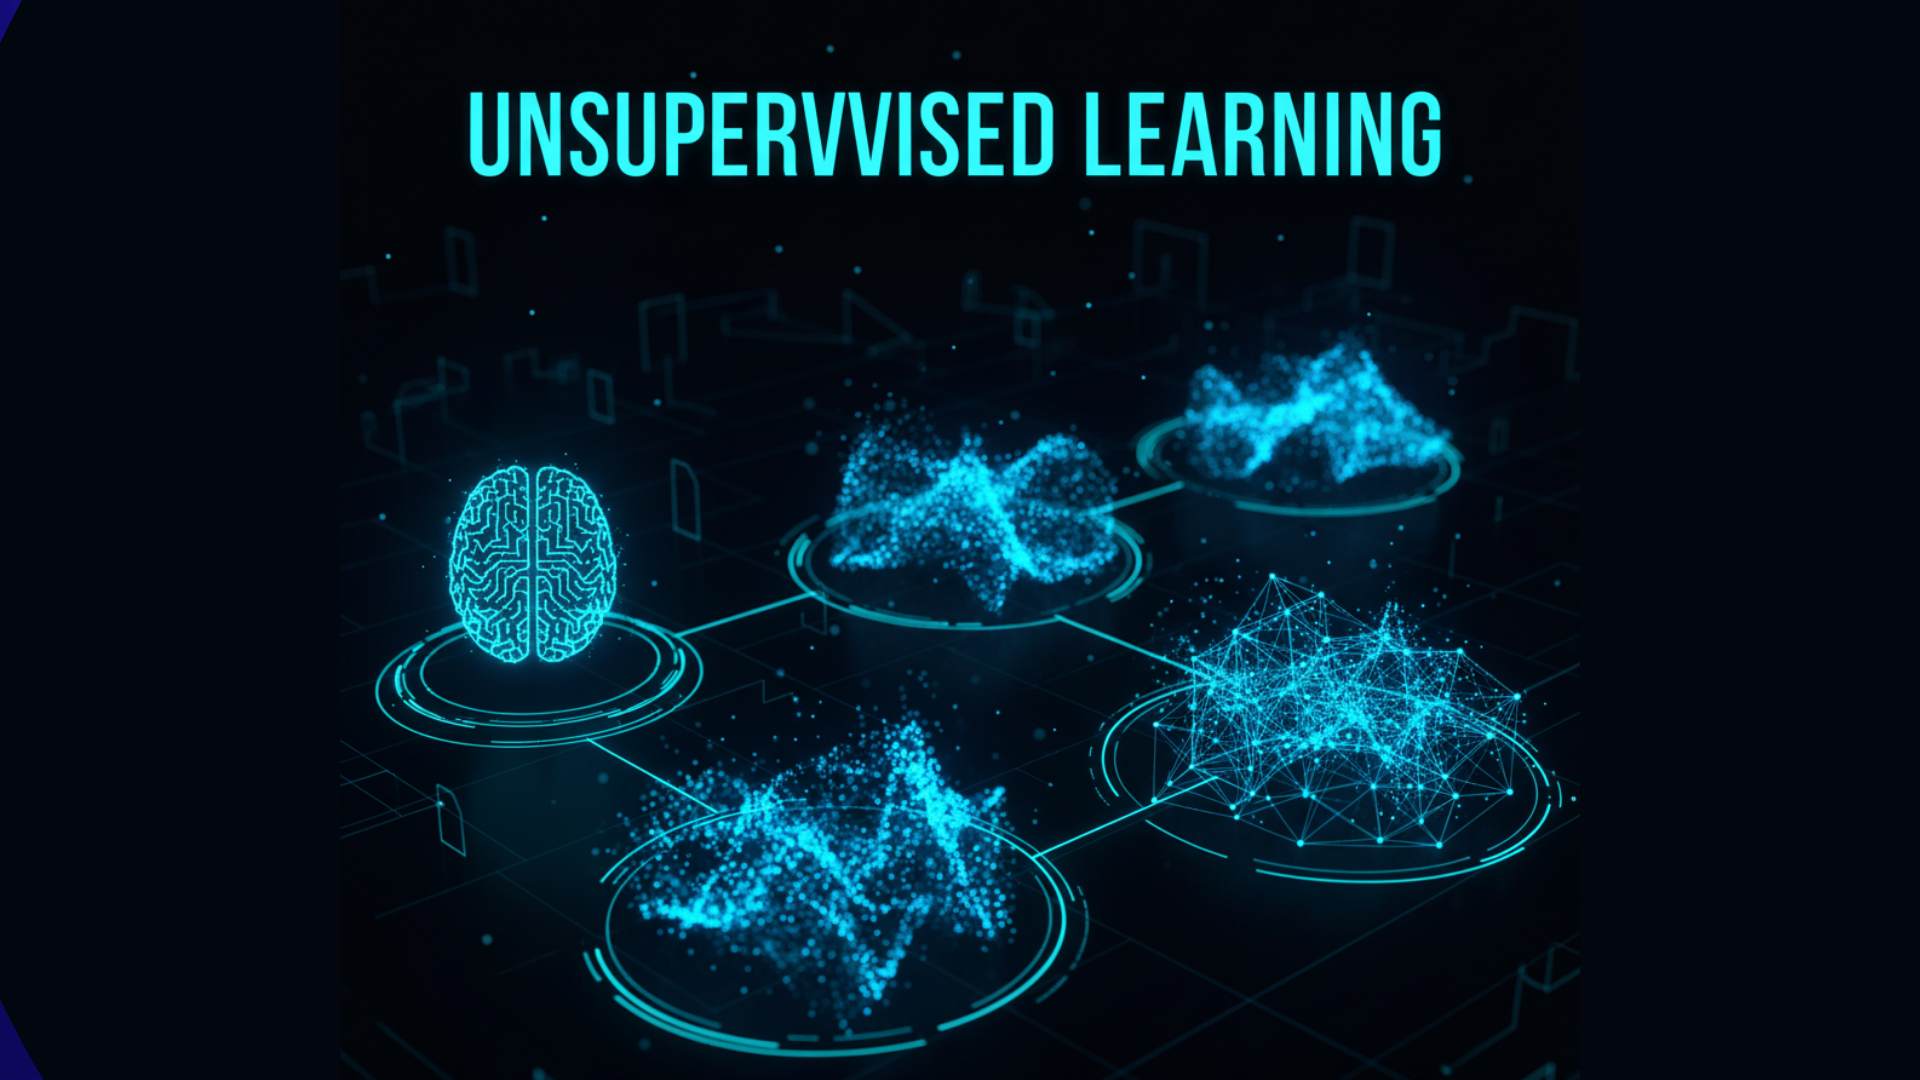
Unsupervised Learning is a type of machine learning where the algorithm is trained on a dataset that contains only input data (X) and no corresponding output labels. The system is not told what to find or where to look. Instead, it must independently identify the inherent structure, patterns, and relationships within the data.
Think of it as an independent explorer analyzing a vast, unlabeled collection of artifacts. No one tells the explorer what the categories are. By examining the objects—their size, material, shape, and design—the explorer might naturally group similar items together, discovering distinct categories like “pottery,” “tools,” and “jewelry,” and even subgroups within them. This process of self-driven discovery is the essence of Unsupervised Learning. The algorithm sifts through the data to find natural clusters, reduce complexity, or unearth hidden rules.
Formally Defined:
The objective of Unsupervised Learning is to model the underlying structure or distribution in the data in order to learn more about the data. Unlike supervised learning, there is no supervisor or teacher to provide guidance. The algorithm must perform this task on its own, making it a powerful tool for knowledge discovery.
Unsupervised Learning vs. Supervised Learning: A Fundamental Dichotomy
Understanding the distinction between these two paradigms is crucial. The core difference lies in the presence or absence of labeled data.
| Feature | Supervised Learning | Unsupervised Learning |
|---|---|---|
| Input Data | Labeled Data (X and Y) | Unlabeled Data (Only X) |
| Goal | Learn a mapping from X to Y to predict outcomes. | Find hidden patterns, intrinsic structures, or groupings in X. |
| Process | Teacher-guided (with answers). | Self-guided (exploration without answers). |
| Algorithms | Linear Regression, Logistic Regression, Random Forest | K-Means, DBSCAN, PCA, Apriori |
| Common Tasks | Classification, Regression | Clustering, Dimensionality Reduction, Association |
| Analogy | Student with a textbook and answer key. | Explorer charting an unknown land. |
This comparison highlights a fundamental shift in approach between the two primary machine learning paradigms. One method operates like a guided student, relying on historical information where the “correct answers” are provided. Its primary goal is predictive accuracy—to build a model that can map inputs to known outputs, such as classifying an email or forecasting a price. In contrast, the other technique is an independent explorer set loose on information without predefined labels. With no answers to learn from, its purpose is discovery; it must find its own patterns, groupings, and underlying structures within the dataset.
The choice between them is dictated by the problem and the data at hand. The guided approach is ideal when you have a specific prediction task and labeled information to train on. The exploratory method is the tool of choice when you need to understand the intrinsic architecture of your data, uncover hidden insights, or when labeled examples are unavailable. Ultimately, they are complementary tools, with the patterns discovered through exploration often informing and enhancing subsequent predictive models.The power of Unsupervised Learning shines in scenarios where labeled data is expensive, impractical, or simply impossible to obtain. It is the key to unlocking insights from the massive troves of unlabeled data that dominate the digital world.
The Three Pillars of Unsupervised Learning
The field of Unsupervised Learning is broadly built upon three foundational types of tasks, each serving a distinct purpose in data analysis.
1. Clustering: The Art of Grouping
Clustering is arguably the most well-known task in Unsupervised Learning. Its objective is to partition the dataset into distinct groups, or “clusters,” such that data points within the same cluster are very similar to each other, and points in different clusters are dissimilar. The definition of “similar” is algorithm-dependent.
Real-World Applications of Clustering in Unsupervised Learning:
- Customer Segmentation: Grouping customers based on purchasing behavior, demographics, and browsing history to enable targeted marketing campaigns. This is a classic use case for Unsupervised Learning in business.
- Document Categorization: Organizing a large collection of documents (articles, emails) into thematic clusters without pre-defined categories.
- Image Segmentation: In computer vision, partitioning an image into multiple segments (clusters of pixels) to simplify its representation and identify objects or boundaries.
- Anomaly Detection: Identifying unusual data points that do not fit well into any cluster. This is critical for fraud detection in financial transactions or identifying faulty equipment in manufacturing.
2. Dimensionality Reduction: Simplifying Complexity
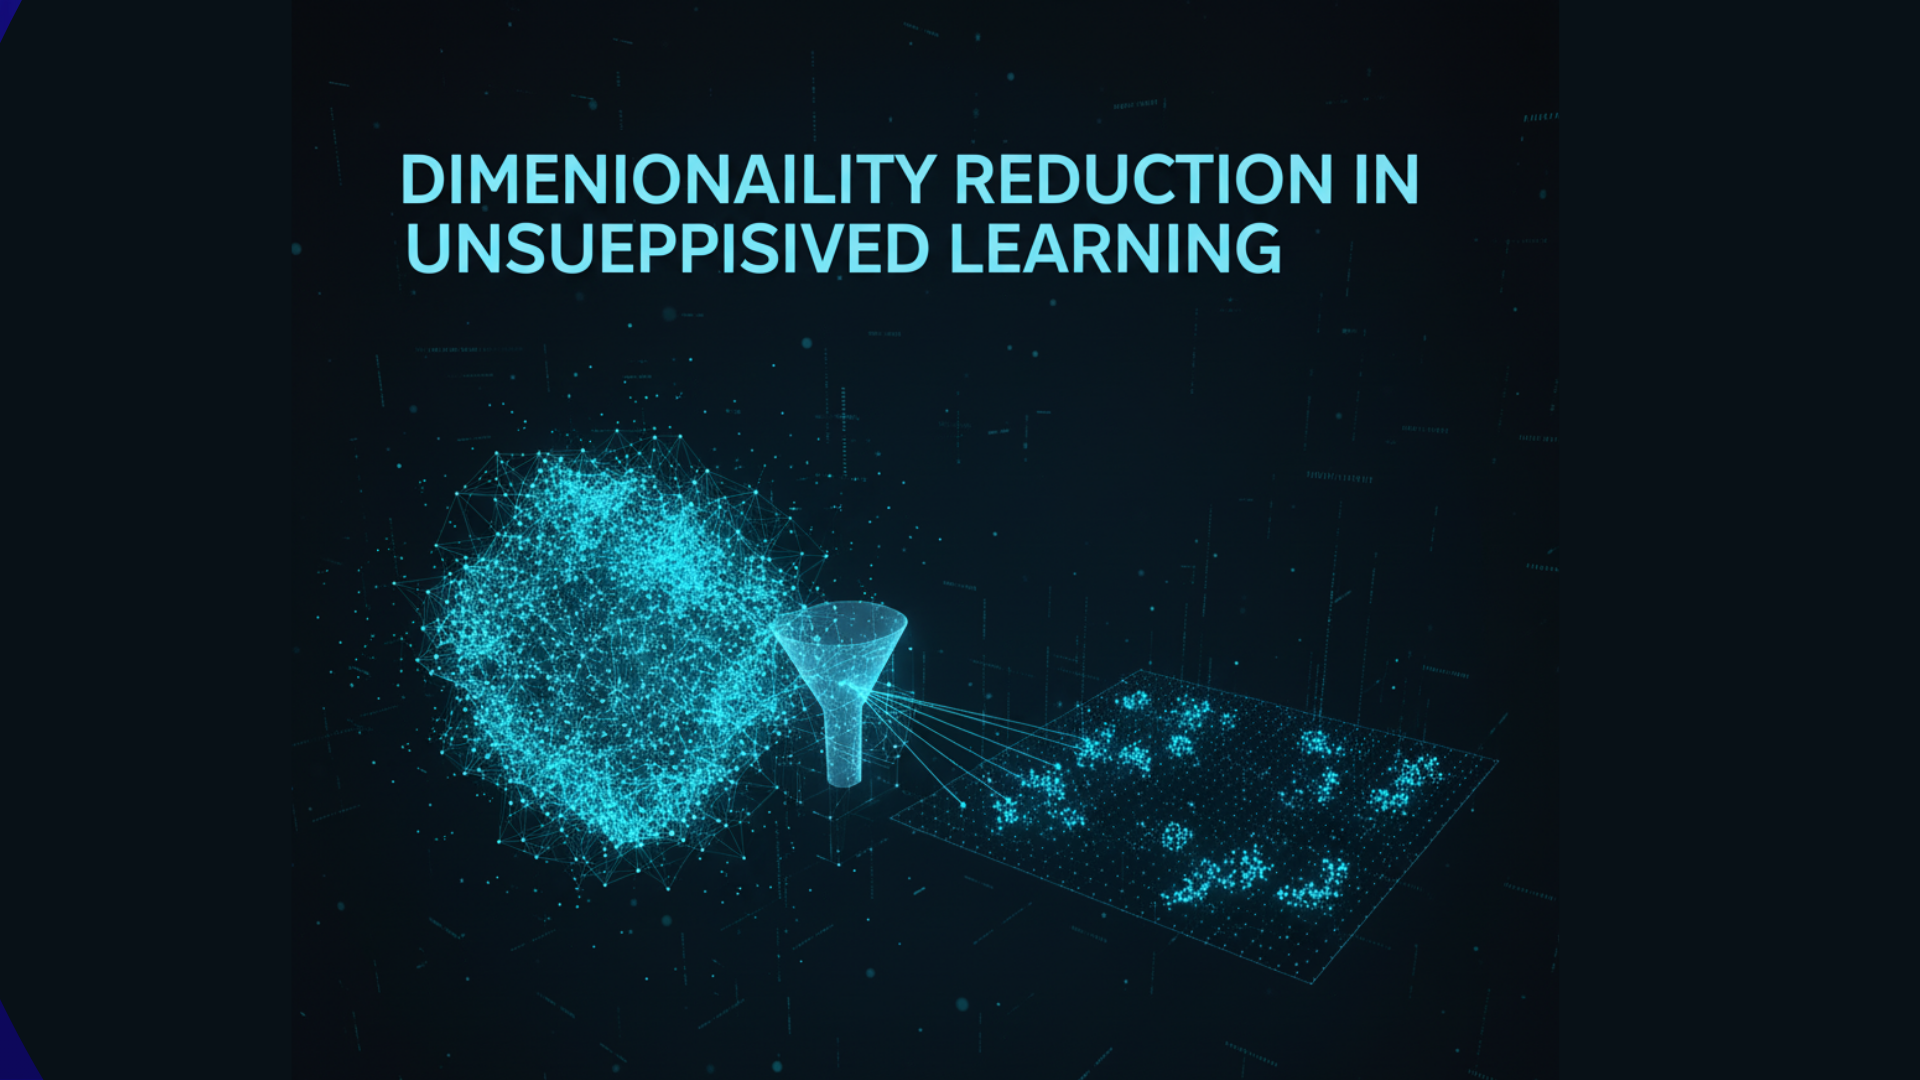
Modern datasets often contain hundreds or even thousands of features (high-dimensional data). This “curse of dimensionality” can lead to computational bottlenecks and poor model performance. Dimensionality reduction techniques within Unsupervised Learning address this by transforming the high-dimensional data into a lower-dimensional space while preserving as much of the meaningful structure (variance) as possible.

Real-World Applications of Dimensionality Reduction in Unsupervised Learning:
- Data Visualization: Projecting high-dimensional data into 2D or 3D for human interpretation. This allows data scientists to visually identify patterns, trends, and outliers.
- Noise Reduction: Many dimensionality reduction techniques can filter out noise, leading to cleaner data for subsequent modeling.
- Feature Engineering: Creating a smaller, more efficient set of features (latent variables) for use in supervised learning models, improving their performance and training speed.
- Genomics: Analyzing gene expression data, which often has thousands of dimensions (genes), by reducing them to a manageable number for analysis.
3. Association Rule Learning: Discovering Hidden Relationships
This branch of Unsupervised Learning aims to discover interesting relations (association rules) between variables in large databases. It is famously used for “market basket analysis,” where the goal is to find items that are frequently purchased together.
Real-World Applications of Association in Unsupervised Learning:
- Recommendation Systems: The classic “customers who bought this also bought…” feature on e-commerce websites is powered by association rule learning.
- Cross-Selling Strategies: Identifying products or services that are naturally linked to inform strategic bundling and promotions.
- Medical Diagnosis: Finding relationships between symptoms, diseases, and patient characteristics to suggest potential co-morbidities.
A Deep Dive into Key Unsupervised Learning Algorithms
Let’s explore the core algorithms that bring the pillars of Unsupervised Learning to life.
Clustering Algorithms

1. K-Means Clustering
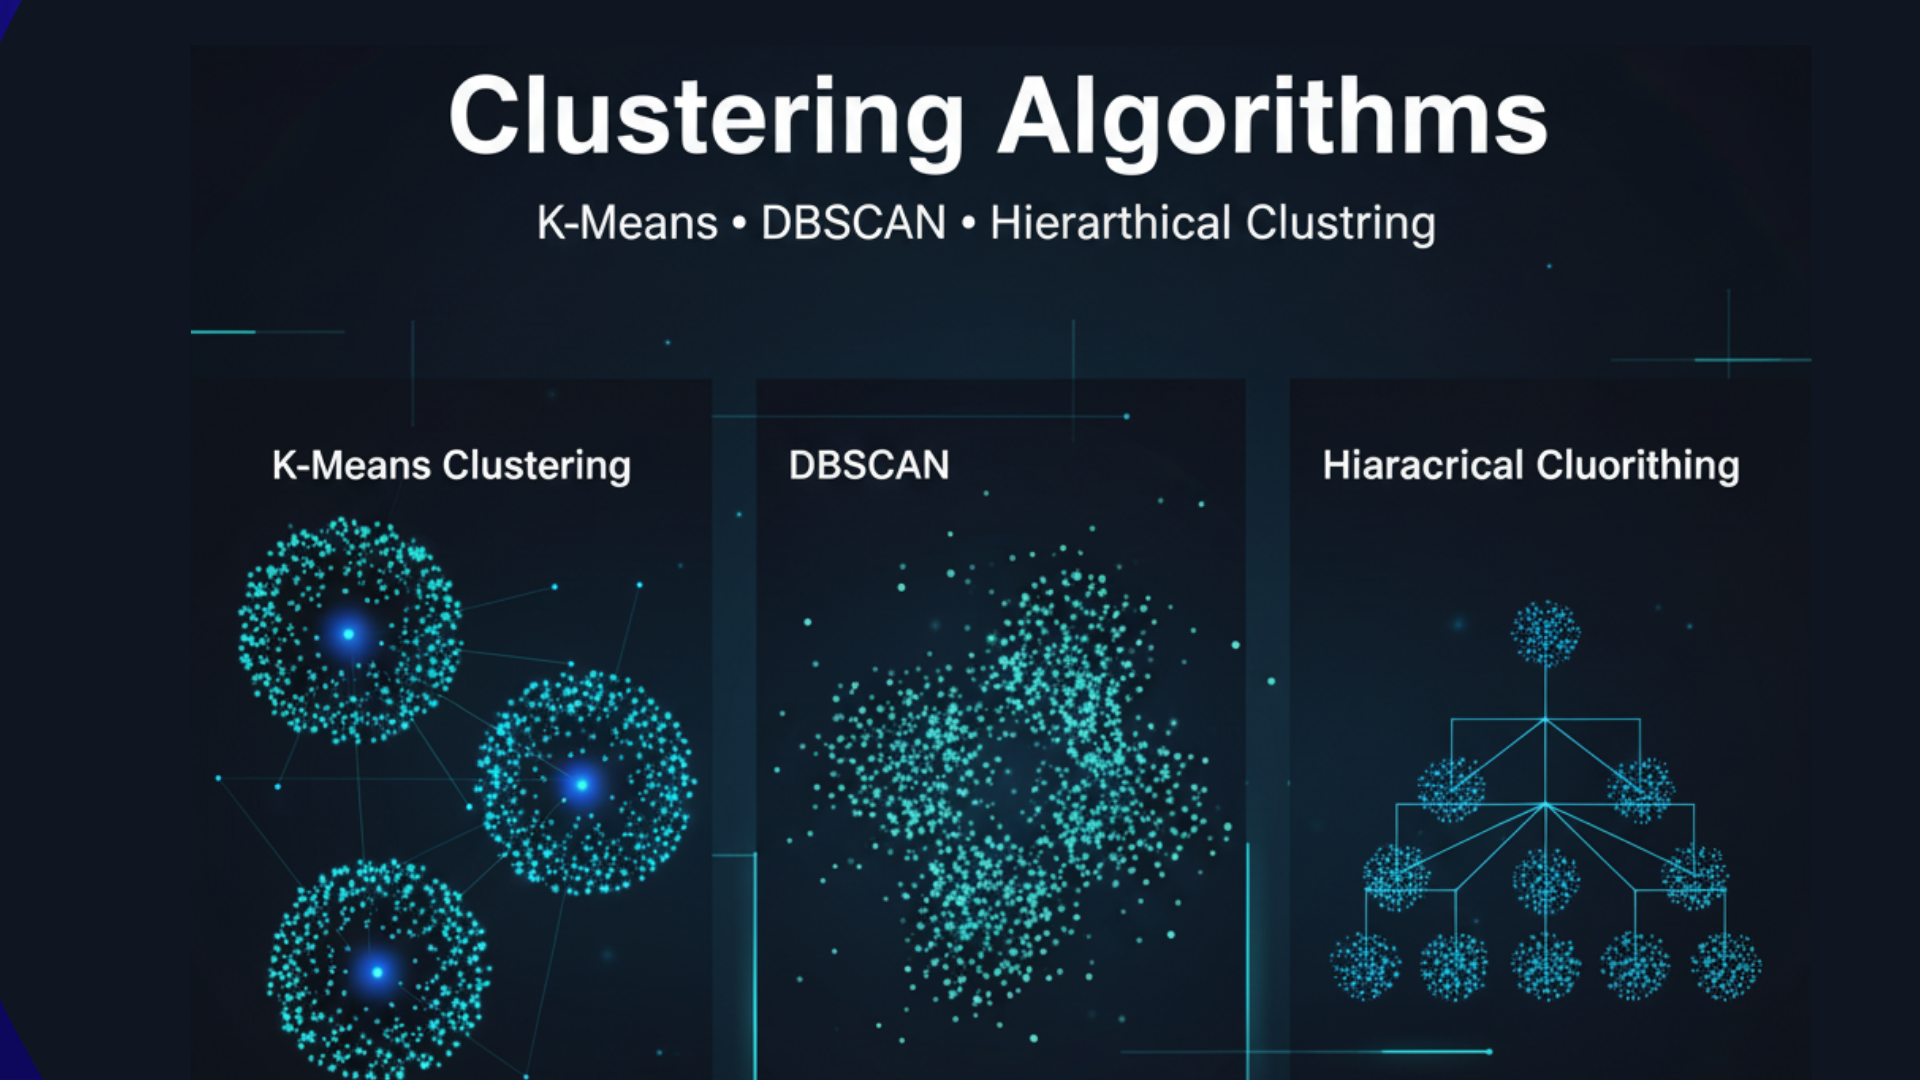
K-Means is the most popular and straightforward clustering algorithm. It is a centroid-based algorithm that is efficient and works well on large datasets.
- How it works: The user specifies the number of clusters
K. The algorithm then:- Randomly initializes K cluster centroids.
- Assigns each data point to the nearest centroid.
- Recalculates the centroids as the mean of all points in the cluster.
- Repeats steps 2 and 3 until the centroids no longer change significantly.
- Pros: Simple, fast, and efficient for large datasets.
- Cons: Requires
Kto be specified in advance, sensitive to initial centroid placement, assumes spherical clusters of similar size, and struggles with clusters of non-convex shapes.
2. DBSCAN (Density-Based Spatial Clustering of Applications with Noise)
DBSCAN is a density-based clustering algorithm that groups together points that are closely packed together, marking points in low-density regions as outliers.
- How it works: It requires two parameters:
eps(the maximum distance between two points to be considered neighbors) andmin_samples(the minimum number of points required to form a dense region). It defines clusters as areas of high density separated by areas of low density. - Pros: Does not require pre-specifying the number of clusters, can find arbitrarily shaped clusters, and is robust to outliers.
- Cons: Struggles with clusters of varying densities and is sensitive to the
epsandmin_samplesparameters.
3. Hierarchical Clustering
This algorithm builds a multilevel hierarchy of clusters by creating a tree of clusters (a dendrogram).
- How it works: It can be either agglomerative (bottom-up), where each point starts as its own cluster and pairs of clusters are merged as one moves up the hierarchy, or divisive (top-down), where all points start in one cluster and splits are performed recursively.
- Pros: The dendrogram provides a rich visual representation of the data structure at different levels of granularity, and the number of clusters does not need to be pre-specified.
- Cons: Computationally expensive for large datasets.
Dimensionality Reduction Algorithms
1. Principal Component Analysis (PCA)
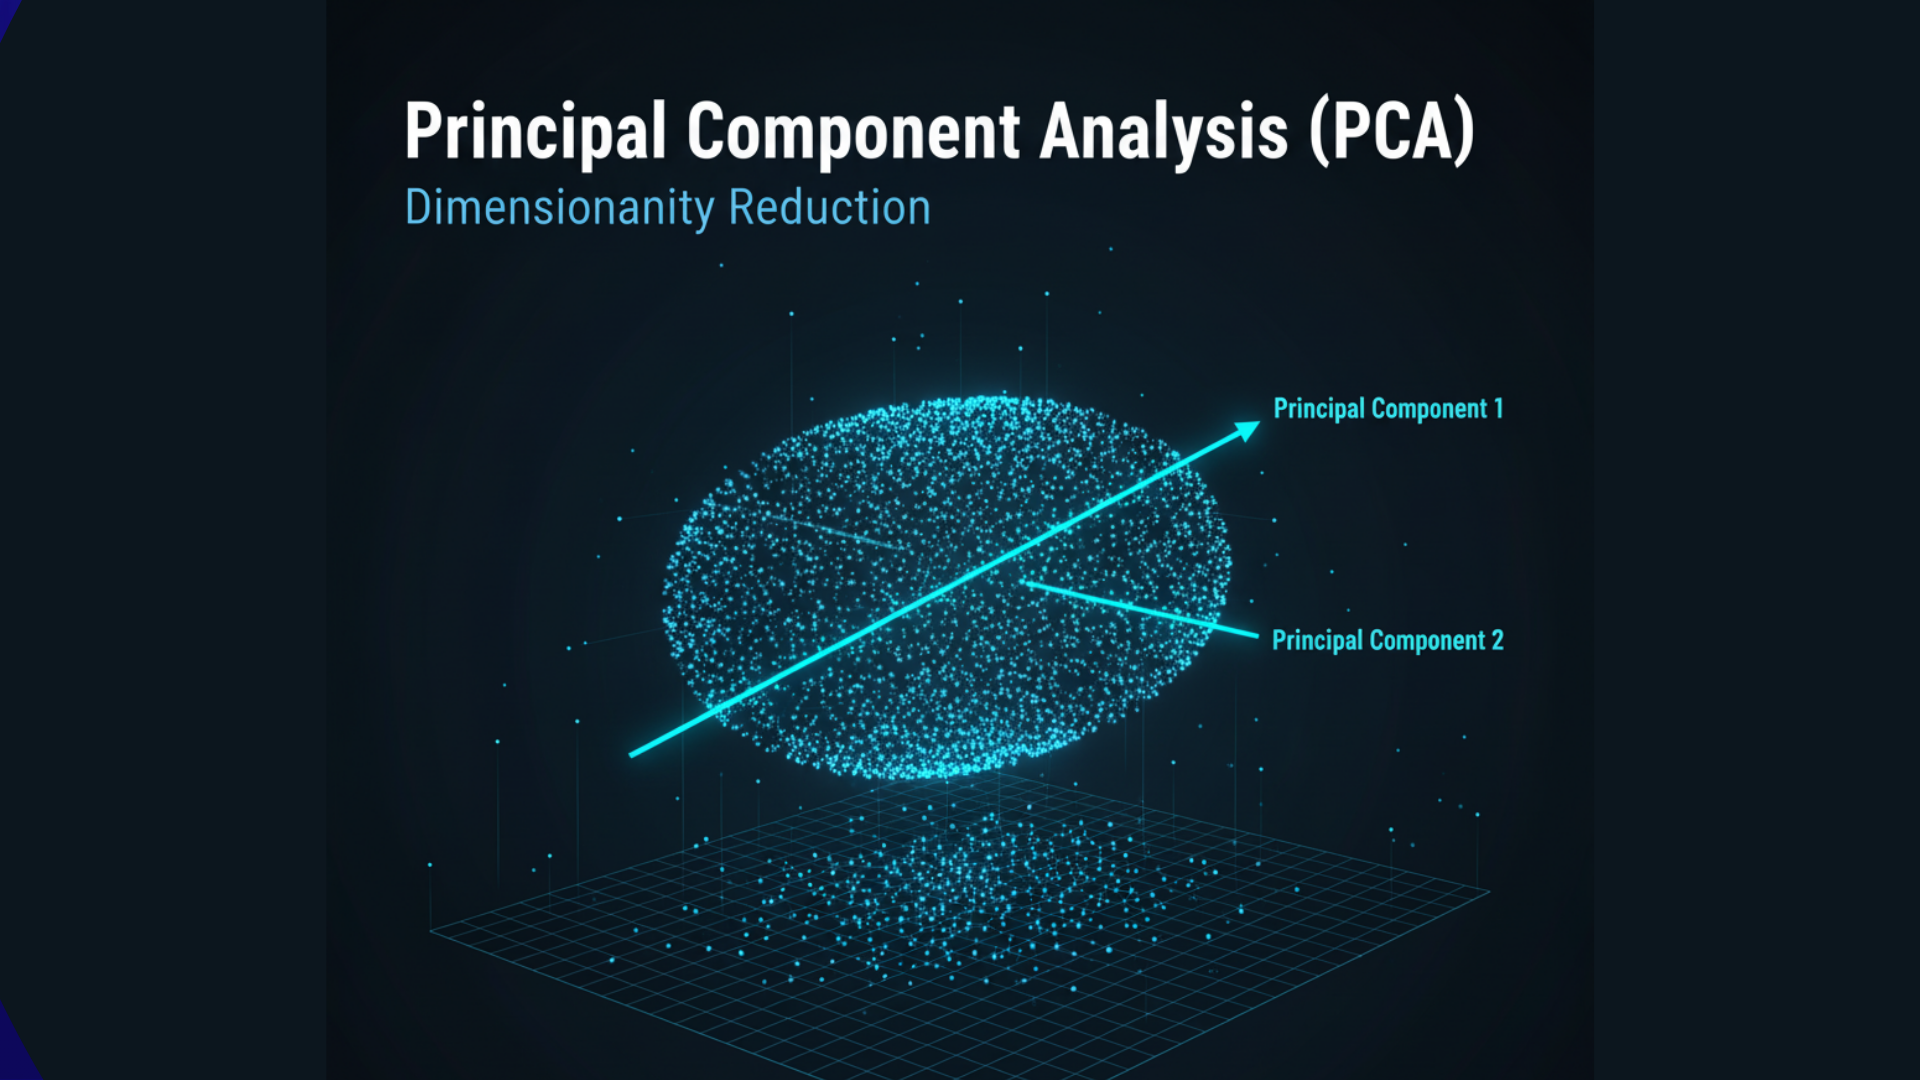
PCA is the most widely used linear technique for dimensionality reduction. It projects the data onto a lower-dimensional subspace while preserving the maximum variance.

- How it works: PCA identifies the directions (called principal components) in which the data varies the most. The first principal component captures the greatest variance, the second (orthogonal to the first) captures the next greatest, and so on. The data is then projected onto these new axes.
- Pros: Reduces noise, simplifies data, and is computationally efficient.
- Cons: The resulting components are linear combinations of the original features and can be difficult to interpret. It assumes linear relationships in the data.
2. t-SNE (t-Distributed Stochastic Neighbor Embedding)
t-SNE is a non-linear technique primarily used for visualization. It is exceptionally good at preserving the local structure of the data, meaning that points that are close in the high-dimensional space will be close in the low-dimensional plot.
- How it works: It converts similarities between data points to joint probabilities and tries to minimize the divergence between these probabilities in the high-dimensional and low-dimensional spaces.
- Pros: Creates visually compelling and intuitive 2D/3D visualizations of complex, high-dimensional data like images or word embeddings.
- Cons: Computationally intensive, the interpretation of the global structure can be misleading, and the results are stochastic (different runs can yield different plots).
3. UMAP (Uniform Manifold Approximation and Projection)
A newer non-linear dimensionality reduction technique, UMAP is often seen as a successor to t-SNE. It is based on rigorous mathematical theory from topological data analysis.
- How it works: UMAP constructs a topological representation of the high-dimensional data and then optimizes a low-dimensional layout to be as topologically similar as possible.
- Pros: Often faster than t-SNE, better at preserving the global structure of the data, and can be used for general-purpose dimensionality reduction beyond just visualization.
- Cons: Like t-SNE, it has hyperparameters that need careful tuning.
Association Rule Learning Algorithms
1. Apriori Algorithm
The Apriori algorithm is a classic method for mining frequent itemsets and learning association rules.
- How it works: It uses a “bottom-up” approach, where frequent subsets are extended one item at a time (a step known as candidate generation), and groups of candidates are tested against the data. It leverages the “Apriori principle”: if an itemset is frequent, then all of its subsets must also be frequent.
- Key Metrics:
- Support: How frequently an itemset appears in the dataset.
- Confidence: The likelihood that item B is purchased when item A is purchased.
- Lift: The ratio of the observed support to that expected if A and B were independent. A lift greater than 1 indicates a useful rule.
- Pros: Simple and easy to understand.
- Cons: Can be computationally expensive and slow for large datasets due to multiple database scans.
The Unsupervised Learning Workflow: A Path to Discovery
While less standardized than the supervised learning workflow, a typical process for an Unsupervised Learning project involves:
- Problem Definition & Goal Setting: Clearly define what you hope to discover. Are you looking for customer segments? Trying to visualize your data? Finding related products?
- Data Preprocessing & EDA: This step is identical in importance to supervised learning. It involves cleaning, handling missing values, and, crucially, feature scaling. Since most Unsupervised Learning algorithms (like K-Means and PCA) are distance-based, scaling is essential to prevent features with larger scales from dominating the analysis.
- Algorithm Selection & Application: Choose the appropriate algorithm (e.g., K-Means for clustering, PCA for visualization) based on your goal.
- Model Training & Result Interpretation: This is the most challenging and subjective part of Unsupervised Learning. There is no “accuracy” to measure. The model produces a result (clusters, components, rules), and the data scientist must interpret its meaning and validity.
- For clustering, one might use metrics like the Silhouette Score or the Davies-Bouldin Index to evaluate cluster quality in the absence of labels.
- For dimensionality reduction, one might look at the cumulative explained variance ratio to decide how many components to keep.
- Iteration and Refinement: Based on the interpretation, you may need to go back and change algorithm parameters, try a different algorithm, or re-engineer features. This is a highly iterative and exploratory cycle.
Evaluating Unsupervised Learning Models: The Challenge of No Ground Truth
The absence of labels makes evaluating Unsupervised Learning models fundamentally different and more challenging. We cannot compute accuracy. Instead, we rely on intrinsic and extrinsic metrics.
Clustering Evaluation Metrics:
- Intrinsic Metrics (Internal Indices): Evaluate the quality of clusters based on the data itself.
- Silhouette Score: Measures how similar an object is to its own cluster compared to other clusters. Ranges from -1 to 1, where a high value indicates well-defined clusters.
- Davies-Bouldin Index: Measures the average similarity between each cluster and its most similar one. Lower values indicate better clustering.
- Extrinsic Metrics (External Indices): Used if ground truth labels are eventually available for validation (e.g., Adjusted Rand Index, Normalized Mutual Information). This is not common in pure Unsupervised Learning scenarios but can be used for benchmarking.
Dimensionality Reduction Evaluation:
- Explained Variance Ratio (for PCA): Shows the proportion of the dataset’s variance that lies along each principal component. This helps decide how many components are sufficient to retain a desired level of information.
Ultimately, the most important evaluation of an Unsupervised Learning model is often its business utility. Do the customer segments make sense to the marketing team? Does the 2D visualization reveal meaningful patterns? Can the association rules be leveraged to increase sales?
Challenges and Limitations of Unsupervised Learning
The power of discovery in Unsupervised Learning comes with a unique set of challenges:
- Subjectivity in Interpretation: The output of an Unsupervised Learning algorithm is often open to interpretation. Different analysts might draw different conclusions from the same clusters or components.
- The Lack of a Clear Goal: Without a specific prediction target, it can be difficult to know when the model is “good enough” or what the “right” number of clusters is.
- Curse of Dimensionality: While dimensionality reduction techniques combat this, many Unsupervised Learning algorithms suffer in very high-dimensional spaces where distance measures become less meaningful.
- Computational Complexity: Some algorithms, like hierarchical clustering or the Apriori algorithm on massive datasets, can be computationally prohibitive.
- Sensitivity to Parameters and Preprocessing: The results of algorithms like K-Means and DBSCAN are highly sensitive to parameter choices and data scaling, requiring careful tuning and domain knowledge.
Conclusion: The Power of Discovery in a Data-Driven World
Unsupervised Learning stands as a pillar of modern data science, offering a unique and powerful lens through which to view our data. It is the key to exploratory data analysis, knowledge discovery, and making sense of the vast, unlabeled datasets that define the modern digital era. From segmenting customers and visualizing complex genomics data to powering recommendation engines, the applications of Unsupervised Learning are vast and impactful.
Mastering Unsupervised Learning requires a blend of technical skill, statistical understanding, and, crucially, human intuition and domain expertise. It is a tool for generating hypotheses, not for testing them in the classical sense. While it presents unique challenges in evaluation and interpretation, its ability to reveal the hidden tapestry within data makes it an indispensable part of the AI and machine learning ecosystem. As we continue to generate data at an unprecedented rate, the role of Unsupervised Learning in helping us understand and navigate this complexity will only become more critical.