Build confidence in your analytics with Data Quality excellence — learn validation, monitoring, and governance essentials.
Have you ever made a major decision based on a number, only to find out later it was completely wrong? Maybe a report showed a sudden spike in sales, and you celebrated—until you realized a technical glitch had double-counted half the orders. That sinking feeling is the direct cost of poor data quality.
Data quality isn’t just a technical buzzword. It’s the difference between confidence and guesswork. It’s what separates impactful, trusted analysis from reports that get ignored. In 2025, with more data coming from more sources than ever, getting data quality right isn’t a luxury; it’s a survival skill.
The good news? You don’t need a fancy title like “Data Quality Manager” to make a difference. As an analyst, you are on the front lines. You see the data first. You feel the pain of messy information directly.
This guide will walk you through 10 practical, powerful data quality best practices you can start using today. These aren’t abstract theories; they are actionable techniques that will save you time, build trust in your work, and make your insights unshakable. Let’s begin.
What is Data Quality, Really? (The Car Dashboard Analogy)
We can talk about dimensions and metrics, but let’s use a simple analogy everyone understands: your car’s dashboard.
Imagine your fuel gauge is broken. It always shows “full.” How useful is that? Not very. You’d run out of gas constantly.
Now, think about your data. Poor data quality is like having broken gauges on your business dashboard. You’re trying to make decisions, but the information you’re looking at is misleading.
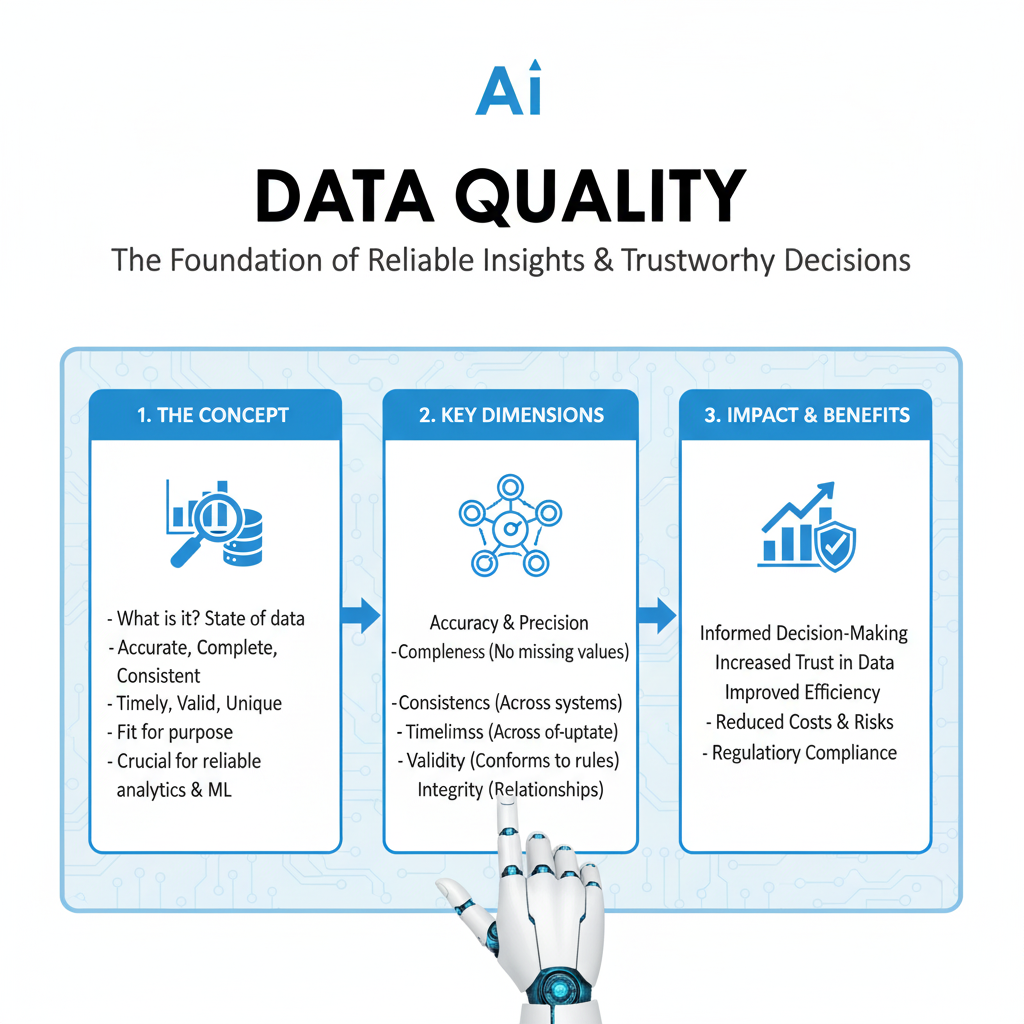
Data quality means your data is:
- Accurate: The fuel gauge shows the actual amount of fuel. (The data correctly represents reality).
- Complete: All the gauges are there—speedometer, RPM, temperature. (No critical pieces of data are missing).
- Consistent: The speedometer shows the same speed as your GPS app. (Data doesn’t contradict itself across different reports).
- Timely: The gauges update in real-time, not with a 5-minute delay. (You have the data when you need it).
- Valid: The speedometer doesn’t show 500 MPH when you’re parked. (The data follows the expected rules and format).
When your data has these qualities, you can trust the story it tells. You can drive your business with confidence.
Why Data Quality is Your Secret Weapon in 2025
You might think, “I’ll just clean the data when I get to it.” But that’s like trying to filter mud out of your water pipe after it’s already flooded your house. Proactive data quality is far more efficient.
1. It Builds Unshakable Trust
When you present an analysis, the first question in your stakeholder’s mind is, “Can I trust these numbers?” Solid data quality practices let you answer with a definitive “yes.” Your reputation becomes tied to reliability.
2. It Saves You a Ton of Time
How many hours have you spent hunting down a weird number, reconciling two different reports, or manually cleaning CSV files? That’s wasted time. Good data quality automates these checks, giving you more time for actual analysis.
3. It Leads to Better Decisions
A decision based on bad data is often worse than no decision at all. It sends your team down the wrong path, wasting money and effort. High-quality data quality is the foundation for smart strategy.
4. It Makes You More Efficient
Clean, well-understood data is easy to work with. Your queries run faster. Your dashboards are simpler to build. Your models are more accurate. Good data quality removes friction from your entire workflow.
The 10 Essential Data Quality Best Practices
1. Define “Good Enough” with Data Quality Standards
You can’t manage what you don’t measure, and you can’t measure what you haven’t defined. The first step is to set clear, simple standards for what “good” data means for your key metrics.
How to do it:
- For each critical data field, write down what a “valid” entry looks like.
- Example for an
emailfield:- Must contain an “@” symbol and a domain.
- Must be less than 100 characters.
- Cannot be null for a registered user.
- Example for a
daily_revenuefield:- Must be a positive number.
- Cannot be more than 50% higher than the same day last week (a simple sanity check).
These standards become your rulebook. They take the subjectivity out of data quality and turn it into a concrete checklist.
2. Implement “Just-in-Time” Data Profiling
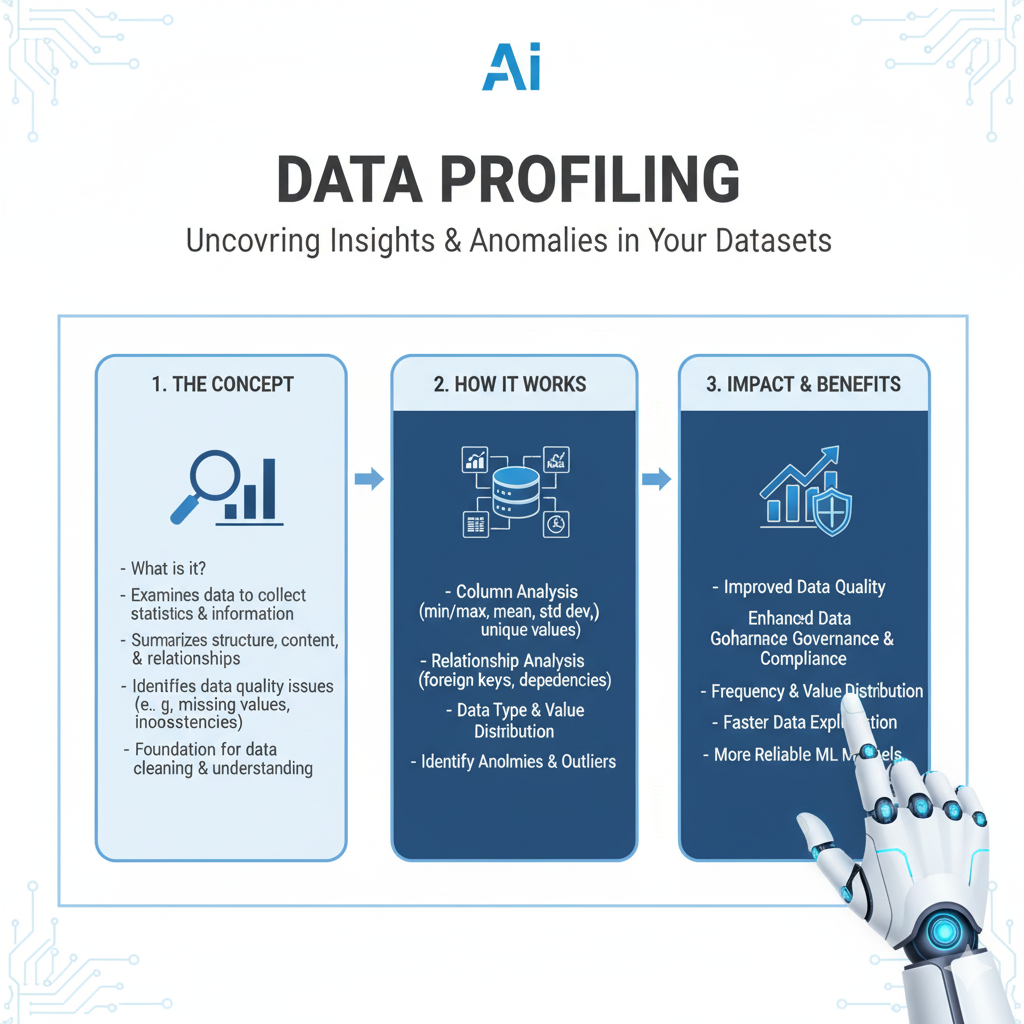
Data profiling is the process of examining your data to understand its structure, content, and quality. You don’t need to do this for every dataset every day. Do it “just-in-time.”
How to do it:
When you first connect to a new data source or a familiar source gets a major update, run a quick profile. In SQL, this looks like:
sql
-- Quick-and-dirty data profile
SELECT
  COUNT(*) as total_rows,
  COUNT(DISTINCT user_id) as unique_users,
  MIN(signup_date) as earliest_date,
  MAX(signup_date) as latest_date,
  SUM(CASE WHEN email IS NULL THEN 1 ELSE 0 END) as null_emails
FROM users;
This 30-second check gives you a powerful snapshot of your data quality. You’ll instantly spot if there are unexpected nulls, strange date ranges, or duplicate IDs.
3. Build Automated Data Validation Checks
This is where you move from manual checking to automated data quality. Create small, automated tests that run against your data, just like a software engineer tests their code.
What to test for:
- Freshness: Is the data updated when it’s supposed to be? (e.g., “The sales table should have new data by 8 AM daily”).
- Volume: Did we receive roughly the expected amount of data? (e.g., “We should get at least 1,000 new orders per day”).
- Accuracy: Do values fall within expected ranges? (e.g., “Age should be between 18 and 100”).
- Uniqueness: Are there duplicate primary keys? (e.g., “Each
order_idshould be unique”).
Tools to use:
You can start simple with SQL assertions or use modern tools like Great Expectations or dbt tests. These tools let you write tests like expect_column_values_to_not_be_null and will automatically alert you when they fail.
4. Create a Single Source of Truth (SSOT)
Nothing destroys data quality faster than confusion. When two people use different data sources to calculate “Monthly Active Users,” you’ll get two different numbers—and a lot of arguments.
How to do it:
- Identify your most important business metrics (e.g., “Revenue,” “Customer Count”).
- Officially document exactly how they are defined and which table or column is the approved source for each one.
- Publish this document where everyone can see it (a wiki, a shared drive).
This “Source of Truth” document stops the debates before they start and ensures everyone is making decisions using the same numbers.
5. Document Your Data Lineage
Data lineage is the story of your data. It answers the questions: “Where did this number come from?” and “What transformations did it go through?”
Why it matters for Data Quality:
If you find a strange number in a dashboard, lineage lets you trace it back through the ETL pipeline to its source to find the root cause. Without it, you’re just guessing.
How to start:
- Keep it simple. For your key reports, just write down:
- Source System: (e.g., “Production PostgreSQL database”)
- Extraction Process: (e.g., “Fivetran syncs data daily”)
- Transformation Logic: (e.g., “Revenue is defined as
amount - refund“)
- Use a tool like DataHub or OpenMetadata to automate this if your ecosystem is complex.
6. Establish a Data Governance “Lite” Framework
“Data Governance” can sound intimidating, like a bureaucratic nightmare. It doesn’t have to be. Think of it simply as “who is responsible for what data?”
A simple starter framework:
- Data Owners: The business leader who defines what the data means. (e.g., The VP of Marketing owns the “customer” data definition).
- Data Stewards: The technical experts (like you!) who ensure the data is accessible, clean, and well-documented.
- Data Consumers: Everyone else who uses the data, and who should report any data quality issues they find.
Just having these simple roles defined makes it clear who to go to with questions or problems.
7. Monitor Data Quality with Key Metrics
You can’t improve what you don’t measure. Track the health of your data with a few key data quality metrics.
Metrics to track:
- Freshness Score: Percentage of datasets updated on time.
- Completeness Score: Percentage of expected data that is not null.
- Volume Anomalies: Number of times data volume deviates significantly from the norm.
- Time-to-Detect: How long it takes from when a data quality issue occurs to when it’s discovered.
Put these metrics on a simple dashboard. This shifts the conversation from “is the data good?” to “how is the health of our data this week?”
8. Cultivate a Data Quality Culture
Data quality is not just one person’s job. It’s everyone’s responsibility. Your goal is to make caring about data quality a normal part of how your team works.
How to foster this culture:
- Celebrate Caught Bugs: When someone finds a data error, thank them! Don’t get defensive. Make it clear that finding problems is a valuable contribution.
- Share Stories: Talk about the cost of a specific data quality failure. “Remember when that duplicate data made us overstock Product X? That’s why we have this check now.”
- Make it Easy to Report Issues: Have a simple channel (like a Slack channel named
#data-quality-issues) where anyone can report a suspicious number without blame.
9. Conduct Regular Data Quality Audits
Set a recurring calendar invite—maybe once a quarter—to do a formal data quality audit on your most critical datasets.
The audit process:
- Review: Re-run your data profiling queries.
- Test: Check that your automated validation checks are still relevant and add new ones if needed.
- Validate: Manually spot-check the data. Pick 10 random records and trace them from source to report to see if the story makes sense.
- Document: Write down your findings and any actions you need to take.
This proactive checkup prevents small issues from slowly growing into big, hidden problems.
10. Design User-Friendly Data Entry Systems
Many data quality problems are created at the very beginning—when data is entered. As an analyst, you might not build these systems, but you can be a powerful voice for the user.
Provide feedback to your engineering teams:
- “The registration form allows people to enter future dates as their birthdate. Can we add validation?”
- “The ‘State’ field is a free-text box, so we have ‘CA,’ ‘Calif.,’ and ‘California.’ Can we change it to a dropdown?”
Preventing bad data from being created is the most effective data quality practice of all.
A Simple Data Quality Checklist for Your Next Project
Feel overwhelmed? Just use this checklist the next time you start a new analysis:
- Profile: Run basic queries to understand data shape and content.
- Validate: Check for nulls, duplicates, and invalid values in key columns.
- Define: Confirm the definition and source for my key metrics.
- Document: Jot down where the data came from and any transformations I applied.
- Spot-Check: Manually review a few records to ensure they make sense.
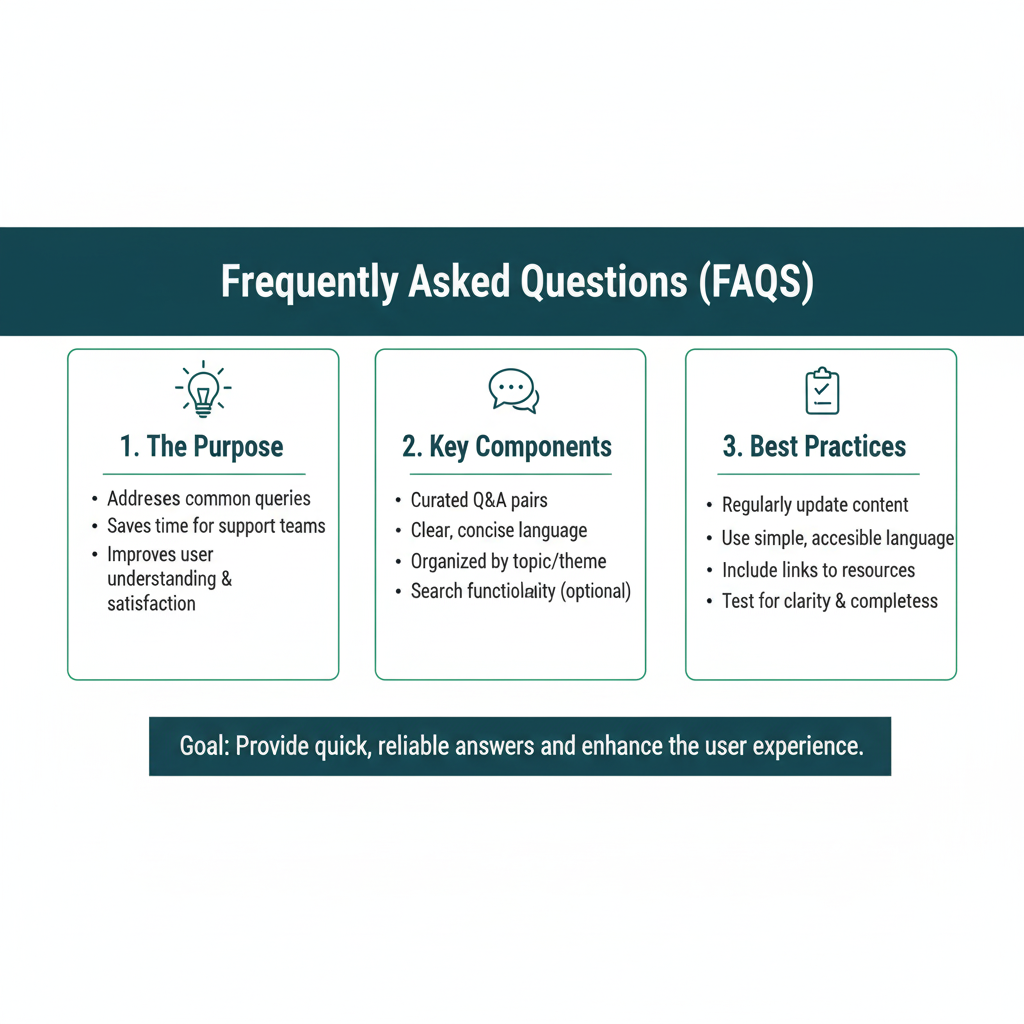
Frequently Asked Questions (FAQs)
Q1: I’m just one analyst. How can I possibly improve data quality for my entire company?
Start small. You don’t have to fix everything at once. Pick one report or one dataset that you personally own. Apply these practices there. When you deliver consistently high-quality analysis from that dataset, it becomes a shining example for others. Influence spreads one trusted dataset at a time.
Q2: What’s the simplest way to start with data quality if we have no process?
Begin with Practice #2: “Just-in-Time” Data Profiling. The next time you get a new dataset, before you do anything else, spend 10 minutes running the profiling queries shown in this article. This single habit will immediately make you more aware of the state of your data and help you catch major issues early.
Q3: How do I convince my manager to invest time in data quality?
Speak their language: risk and ROI. Explain the cost of a past decision made with bad data. Frame data quality not as a cost center, but as “insurance” against making expensive mistakes. Propose a small, low-time-investment pilot project to show the value.
Q4: We have too many data quality issues. Where should I focus first?
Use the Pareto Principle. 80% of the impact comes from 20% of the data. Identify the 2-3 most critical reports or datasets that drive the biggest business decisions. Focus your data quality efforts there first. Don’t try to boil the ocean.
Q5: How should we handle data quality issues that we discover after analysis has been published and decisions have been made?
This is one of the most challenging situations an analyst can face, blending technical correction with professional communication. The key is to act quickly, transparently, and constructively.
First, assess the impact: Determine the scope of the error. Was it a minor rounding discrepancy in a supporting chart, or did it fundamentally change the conclusion of a major strategic report? This will dictate your response.
Follow this communication protocol:
- Immediate Notification: Alert all stakeholders who received the original analysis directly and promptly. Don’t wait for them to discover it. A brief, direct message works best: “I’ve identified an error in the [Report Name] distributed on [Date] that affects [specific metric]. I’m investigating the root cause and will provide corrected figures by [specific time].”
- Provide Context, Not Excuses: Explain what the error was in simple terms (e.g., “A filter was incorrectly applied, excluding international sales”), but avoid overly technical jargon or blaming individuals. Focus on the facts.
- Deliver the Correction: Circulate the corrected analysis clearly marked as “V2” or “Corrected,” with a summary of what changed and how it impacts the original conclusions.
- Explain the Fix: Briefly describe the new process or check you are putting in place to prevent this specific error from happening again. This transforms a failure into a demonstration of your commitment to data quality.
This approach, while uncomfortable, ultimately builds long-term trust. It shows integrity and a commitment to truth over ego.
Q6: What’s the difference between data validation and data monitoring, and how do they work together in a mature data quality framework?
Think of data validation and data monitoring as two different security systems for your data, each designed to catch different types of threats. They are complementary, not interchangeable.
Data Validation is the Airport Security Checkpoint. It’s a point-in-time, rule-based check that happens at a specific stage in the data pipeline. Its job is to stop obviously invalid data from proceeding further.
- What it checks: Syntax, format, and adherence to strict business rules.
- Examples:
- Ensuring an
emailcolumn contains the “@” symbol. - Verifying a
agefield is a number between 0 and 120. - Checking for
NULLvalues in a requiredcustomer_idfield.
- Ensuring an
- Action: It typically blocks the pipeline or quarantines faulty records. It answers, “Does this data meet our basic entry requirements?”
Data Monitoring is the Neighborhood Watch. It is a continuous, ongoing process that watches over your data assets in near real-time. Its job is to detect subtle anomalies, drifts, and trends in data that has already passed validation.
- What it checks: Statistical properties, patterns, and trends over time.
- Examples:
- Alerting if today’s number of new user sign-ups is 50% lower than the 30-day average.
- Flagging if the average order value suddenly drops by 2 standard deviations.
- Notifying if the ratio of
NULLs in a specific column slowly creeps up from 1% to 5% over a month.
- Action: It alerts and notifies for investigation. It answers, “Is the behavior of this data normal and expected?”
How They Work Together:
A mature data quality framework uses both. Validation acts as the front-line defense, catching clear-cut errors as data enters your system. Monitoring acts as the secondary, continuous defense, catching more complex, emergent issues that occur during data processing or from subtle source system changes. You need the checkpoint to stop prohibited items, and you need the neighborhood watch to spot the suspicious van driving down the street.
Conclusion: Become the Most Trusted Analyst in the Room
In a world drowning in data, the ability to separate the signal from the noise is a superpower. Data quality is the foundation of that superpower.
This isn’t about being a perfectionist. It’s about being a professional. It’s about building a reputation for reliability that makes people seek out your analysis because they know it’s built on a rock-solid foundation.
You don’t need to implement all 10 practices today. Pick one. Maybe it’s defining your “Single Source of Truth” for the metric you use most often. Or perhaps it’s adding one simple automated check to your next project.
Each step you take will make your work easier, your insights sharper, and your voice more influential. In the economy of 2025, trust is the most valuable currency. Let high data quality be your way of earning it.