
Introduction: Beyond the Simple Train-Test Split – Why Cross Validation is Non-Negotiable
In the practice of machine learning, one of the most critical questions is: “How well will my model perform on new, unseen data?” Relying on a single, static split of data into training and testing sets is a fragile and often misleading approach. A model might achieve a high score on one arbitrary test set but fail catastrophically in the real world due to overfitting—the phenomenon where a model learns the noise and specific idiosyncrasies of the training data rather than the underlying generalizable pattern.
Cross Validation is the foundational statistical methodology designed to solve this exact problem. It is a resampling technique used to assess the predictive performance of machine learning models and to ensure their robustness and generalizability. The core principle of Cross Validation is to repeatedly partition the original dataset into different training and validation sets, train the model on each training set, and evaluate it on the corresponding validation set. The final performance metric is an aggregate (usually the mean and standard deviation) of the scores from all iterations.
This process provides a much more reliable and trustworthy estimate of a model’s true performance for several key reasons:
- Reduces Variance of the Estimate: A single train-test split can give you a lucky or unlucky score based on which data points end up in the test set. By averaging the results over multiple splits, Cross Validation smooths out this randomness, providing a more stable and representative performance metric.
- Maximizes Data Utility: In a simple hold-out method, a portion of the data (the test set) is never used for training. In many Cross Validation schemes, every data point is used for both training and validation at different times, which is especially crucial when working with smaller datasets where every sample is valuable.
- Detects Overfitting: If a model’s performance varies wildly across different validation folds, it is a clear sign of overfitting or high variance. The standard deviation of the cross-validation scores is a useful diagnostic tool.
- Informs Model Selection and Tuning: Cross Validation is the gold standard for comparing different algorithms and for hyperparameter tuning (e.g., using
GridSearchCV), as it ensures the selected model or parameters are the most robust.
This article provides a deep dive into the top 7 Cross Validation techniques, moving from fundamental methods applicable to most problems to advanced strategies designed for specific data structures and challenges. Each technique will be explained with its underlying intuition, mechanics, ideal use cases, and practical Python implementation.
Part 1: The Foundational Techniques
These three methods form the bedrock of model evaluation. They are widely applicable, computationally efficient, and should be the starting point for most machine learning projects.
1. K-Fold Cross Validation
Detailed Explanation:
K-Fold Cross Validation is arguably the most commonly used Cross Validation technique. The procedure is systematic:
- Shuffling and Splitting: The dataset is first randomly shuffled to eliminate any order effects. It is then divided into k contiguous folds of approximately equal size. The value ‘k’ is a user-defined parameter, with 5 and 10 being the most common choices.
- Iterative Training and Validation: The model is trained and validated k times. In each iteration (or “fold”), a different fold is held out as the validation set, and the remaining k-1 folds are combined to form the training set.
- Performance Aggregation: After k iterations, you have k different performance scores (e.g., accuracy, MSE). The final reported performance of the model is the average of these k scores. The standard deviation of these scores is also often reported to indicate the variability of the model’s performance.
Mathematical Intuition:
Let M be your model and D be your dataset of size n. K-Fold CV provides an estimate of the expected prediction error:Err = E[L(Y, M(X))] ≈ (1/k) * Σ L(y_validation_i, M_train_i(x_validation_i)) for i = 1 to k,
where L is the loss function (e.g., mean squared error). This average is a much better estimator of the true generalization error than a single hold-out estimate.
When to Use It:
- Default Choice for Regression: For regression problems where the target variable is continuous, standard K-Fold is typically sufficient.
- Balanced Datasets: When working with classification problems that have reasonably balanced classes.
- General Purpose Model Assessment: Whenever you need a quick, robust, and standard way to evaluate a model’s performance.
Python Implementation:
python
import numpy as np
from sklearn.model_selection import cross_val_score, KFold
from sklearn.ensemble import RandomForestClassifier
from sklearn.datasets import make_classification
#Cross Validation
# Generate a sample dataset
X, y = make_classification(n_samples=1000, n_features=20, n_informative=15, n_redundant=5, random_state=42)

# Initialize the model
model = RandomForestClassifier(n_estimators=100, random_state=42)
#Cross Validation
# Define a 5-Fold Cross Validator.
# `shuffle=True` is crucial to randomize the data before splitting.
kfold = KFold(n_splits=5, shuffle=True, random_state=42)

# Perform cross-validation. `cross_val_score` handles the splitting, training, and scoring.
scores = cross_val_score(model, X, y, cv=kfold, scoring='accuracy')

print("Accuracy scores for each fold:", scores)
print(f"Mean Accuracy: {scores.mean():.4f} (+/- {scores.std() * 2:.4f})")
# The output '(+/- X.XXXX)' represents a 95% confidence interval for the mean score.
2. Stratified K-Fold Cross Validation
Detailed Explanation:
Stratified K-Fold is a vital variation of K-Fold that is specifically designed for classification problems. The key weakness of standard K-Fold in classification is that a random split might by chance result in folds where the distribution of the target classes is very different from the distribution in the full dataset. For example, in a binary classification problem with 90% ‘Class A’ and 10% ‘Class B’, a random fold might contain only 2% of ‘Class B’, making it a poor representation of the overall problem.
Stratified K-Fold rectifies this by ensuring that each fold preserves the same percentage of samples of each target class as the complete set. This is done by stratifying the data based on the labels (y).
Why it Matters:
For imbalanced datasets, using standard K-Fold can lead to misleading validation scores. A fold with very few minority class samples might yield a deceptively high accuracy (by simply predicting the majority class) or an unrealistically low one. Stratified K-Fold ensures that each fold is a microcosm of the overall class distribution, leading to a more realistic and reliable performance estimate, especially for metrics like precision, recall, and F1-score which are sensitive to class distribution.
When to Use It:
- Default for Classification: It should be your default choice for almost all classification problems.
- Imbalanced Datasets: It is absolutely essential when dealing with imbalanced class distributions.
- Multi-class Classification: It works equally well for problems with more than two classes.
Python Implementation:
python
from sklearn.model_selection import StratifiedKFold
from sklearn.linear_model import LogisticRegression
#Cross Validation
# Let's create a more realistic imbalanced dataset.
X, y = make_classification(n_samples=1000, n_features=20, n_classes=2, weights=[0.9, 0.1], random_state=42)
# 'weights=[0.9, 0.1]' means 90% of samples belong to class 0 and 10% to class 1.
print(f"Original class distribution: Class 0: {np.sum(y==0)}, Class 1: {np.sum(y==1)}")

model = LogisticRegression(max_iter=1000)
#Cross Validation
# Standard K-Fold (for comparison - can be problematic)
standard_kfold = KFold(n_splits=5, shuffle=True, random_state=42)
standard_scores = cross_val_score(model, X, y, cv=standard_kfold, scoring='accuracy')
print(f"Standard K-Fold Mean Accuracy: {standard_scores.mean():.4f}")

# Stratified K-Fold (the correct approach)
stratified_kfold = StratifiedKFold(n_splits=5, shuffle=True, random_state=42)
stratified_scores = cross_val_score(model, X, y, cv=stratified_kfold, scoring='accuracy')
print(f"Stratified K-Fold Mean Accuracy: {stratified_scores.mean():.4f}")

# For imbalanced data, accuracy can be misleading. Let's use F1-score.
stratified_f1 = cross_val_score(model, X, y, cv=stratified_kfold, scoring='f1_macro') # 'f1', 'f1_micro', 'f1_weighted' are other options
print(f"Stratified K-Fold Mean F1 (Macro): {stratified_f1.mean():.4f}")
# Macro-averaging calculates metrics for each class independently and then takes the average.
# This treats all classes equally, making it sensitive to the performance on the minority class.
3. Leave-One-Out Cross Validation (LOOCV)
Detailed Explanation:
Leave-One-Out Cross Validation is the most extreme form of K-Fold Cross Validation, where the number of folds k is set equal to the number of observations n in the dataset. This means that for a dataset with n samples, LOOCV will create n different train-test splits. In each split, the training set consists of n-1 samples, and the test set consists of the single remaining sample.
The model is trained on all data except one point and then tested on that held-out point. This process is repeated such that every single data point in the dataset gets to be the test set exactly once.
Mathematical Properties:
LOOCV is an almost unbiased estimator of the generalization error, as each training set contains n-1 samples, making it virtually identical to the full dataset. However, this comes at a cost: the estimates from each fold are highly correlated with each other (since the training sets overlap significantly), leading to high variance in the estimator. Furthermore, it is computationally very expensive, as it requires fitting the model n times.
When to Use It:
- Very Small Datasets: Its primary use case is with very small datasets (e.g., < 100 samples) where withholding a large portion of data for a test set, as in K-Fold, is not feasible. Using almost all data for training in each iteration is a major advantage here.
- Benchmarking: It can be useful for providing a benchmark on small datasets.
- Avoid: It should generally be avoided for larger datasets due to its computational cost and high variance.
Python Implementation:
python
from sklearn.model_selection import LeaveOneOut, cross_val_score
from sklearn.linear_model import Ridge
#Cross Validation
# Create a small dataset to demonstrate
X_small, y_small = X[:50], y[:50] # Using the first 50 samples from our previous dataset
#Cross Validation
model = Ridge(alpha=1.0)

# Use Leave-One-Out CV
loo = LeaveOneOut()
# Note: We use 'neg_mean_squared_error'. Scikit-learn convention is to maximize scores, so losses are negated.
loo_scores = cross_val_score(model, X_small, y_small, cv=loo, scoring='neg_mean_squared_error')

print(f"Number of iterations: {len(loo_scores)}") # Will be 50
print(f"Mean MSE: {-loo_scores.mean():.4f}") # Negate the score to get the actual MSE
print(f"Standard Deviation of MSE: {loo_scores.std():.4f}")
Part 2: Advanced and Specialized Techniques
These methods address specific data structures and challenges that the foundational techniques cannot handle effectively, such as temporal dependencies, grouped data, or the need for ultra-robust estimates.
4. Leave-P-Out Cross Validation
Detailed Explanation:
Leave-P-Out (LPO) is a generalization of LOOCV. Instead of leaving out one sample at a time, it leaves out all possible subsets of p samples. For a dataset of size n, this method generates all possible combinations of choosing p samples for the test set, with the remaining n-p samples used for training. The number of splits and models to be trained is given by the binomial coefficient n choose p, which can be astronomically large.
For example, with n=100 and p=2, you would have to train 100 choose 2 = 4950 models. With n=100 and p=10, the number of splits is over 17 trillion, making it computationally infeasible.
Intuition and Drawbacks:
While LPO provides an exhaustive and theoretically comprehensive evaluation, its computational cost renders it impractical for almost all real-world scenarios. It is primarily of theoretical interest. LOOCV is simply a special case of LPO where p=1.
When to Use It:
- Extremely Rarely. Only for very small datasets (n < 20) and very small values of
p(p=1, 2, or 3) where the number of combinations is manageable. - Theoretical Research: For demonstrating concepts or in educational contexts.
Python Implementation:
python
from sklearn.model_selection import LeavePOut
import warnings
warnings.filterwarnings('ignore') # Suppress warnings for clean output

# Using a tiny dataset to make it feasible
X_tiny, y_tiny = X[:10], y[:10] # Only 10 samples
#Cross Validation
model = LogisticRegression(max_iter=1000)
lpo = LeavePOut(p=2) # Leave out 2 samples at a time

# Calculate the number of splits
num_splits = lpo.get_n_splits(X_tiny)
print(f"Number of splits for n=10, p=2: {num_splits}") # Output: 45
#Cross Validation
# WARNING: Uncommenting and running the next line would fit 45 models. It's fine for n=10, but be cautious.
# lpo_scores = cross_val_score(model, X_tiny, y_tiny, cv=lpo)
# print(f"LPO Mean Accuracy: {lpo_scores.mean():.4f}")
5. Time Series Split

Detailed Explanation:
Standard cross-validation techniques assume that data points are Independent and Identically Distributed (IID). This assumption is violently broken in time series data, where there is a clear temporal order and dependency between observations (e.g., today’s stock price is correlated with yesterday’s).
Using K-Fold on time series data would lead to data leakage: the model would be trained on future data to predict the past, which is impossible in a real-world forecasting scenario. This produces overly optimistic and completely invalid performance estimates.
Time Series Split respects the temporal order. The training set is always a contiguous block of time that comes entirely before the validation set. As the split moves forward, the training window can either be a fixed size (a “rolling window”) or can grow over time (an “expanding window”).
How it Works:
For n_splits=5, the data is split into 6 segments. The process is as follows:
- Fold 1: Train on segment 1, validate on segment 2.
- Fold 2: Train on segments 1-2, validate on segment 3.
- Fold 3: Train on segments 1-3, validate on segment 4.
- …and so on.
This perfectly simulates a real-world scenario where you use all available historical data up to a certain point to predict the next period.
When to Use It:
- Mandatory for Time Series Forecasting: Any problem involving temporal data, such as stock prices, sales data, sensor readings, or energy demand.
- Any Data with a Sequential Order: Where the order of samples matters and the future should not influence the past.
Python Implementation:
python
from sklearn.model_selection import TimeSeriesSplit
from sklearn.linear_model import LinearRegression
import pandas as pd
#Cross Validation
# Create a synthetic time series dataset
dates = pd.date_range(start='2020-01-01', end='2023-12-31', freq='D')
n_samples = len(dates)
np.random.seed(42)

# Create a synthetic time series with a trend and seasonality
time = np.arange(n_samples)
y_ts = 0.5 * time + 10 * np.sin(2 * np.pi * time / 365) + np.random.randn(n_samples) * 5
# Feature: we can use lagged values, but for simplicity, we'll just use the time index.
X_ts = time.reshape(-1, 1)

model = LinearRegression()

# Use Time Series Split
tscv = TimeSeriesSplit(n_splits=5)
print("TimeSeriesSplit behavior:")

# Let's visualize what happens in each fold
for fold, (train_index, test_index) in enumerate(tscv.split(X_ts)):
    print(f"Fold {fold}: Train observations: {train_index[0]} to {train_index[-1]} (n={len(train_index)}) | "
          f"Test observations: {test_index[0]} to {test_index[-1]} (n={len(test_index)})")
#Cross Validation
# Perform the cross-validation
ts_scores = cross_val_score(model, X_ts, y_ts, cv=tscv, scoring='neg_mean_squared_error')
print(f"\nTime Series Cross-Validation Mean MSE: {-ts_scores.mean():.4f}")
6. Group K-Fold
Detailed Explanation:
Group K-Fold addresses the problem of non-IID data that arises from grouped or clustered data points. In many datasets, samples are not independent; they belong to natural groups. Examples include:
- Medical Data: Multiple measurements taken from the same patient.
- Speech Recognition: Multiple audio clips from the same speaker.
- E-commerce: Multiple purchases made by the same customer.
If samples from the same group are present in both the training and test sets, information about that group “leaks” between the sets. The model might learn specific patterns of that group rather than general patterns, leading to an over-optimistic validation score. Group K-Fold ensures that all samples from a specific group are placed exclusively in one fold, either entirely in the training set or entirely in the test set for a given split.
How it Works:
The algorithm takes an array of group labels. It then ensures that each distinct group appears exclusively in one test fold. The folds are approximately balanced in the number of groups, but not necessarily in the number of samples, as groups can be of different sizes.
When to Use It:
- Data with Natural Groupings: Whenever your dataset has groups and you want to test the model’s ability to generalize to entirely new, unseen groups.
- Preventing Data Leakage: To avoid the inflated performance estimates that come from having correlated samples in both training and testing sets.
Python Implementation:
python
from sklearn.model_selection import GroupKFold
from sklearn.svm import SVC
#Cross Validation
# Create a dataset with explicit groups.
# Suppose we have measurements from 5 different subjects, with a different number of samples per subject.
np.random.seed(42)
n_samples = 50
X_group = np.random.randn(n_samples, 4)
y_group = np.random.randint(0, 2, n_samples)
# Create group labels: 5 groups, with 10 samples each.
groups = np.repeat([0, 1, 2, 3, 4], 10)

print("Group memberships:", groups)

model = SVC(kernel='linear', random_state=42)

# Use Group K-Fold
group_kfold = GroupKFold(n_splits=5) # We have 5 groups, so we can do 5-fold.
print("\nGroupKFold behavior:")
#Cross Validation
for fold, (train_index, test_index) in enumerate(group_kfold.split(X_group, y_group, groups)):
    train_groups = np.unique(groups[train_index])
    test_groups = np.unique(groups[test_index])
    print(f"Fold {fold}: Train groups {train_groups} | Test groups {test_groups}")
    # Notice that the test set for each fold contains exactly one group.

# Perform cross-validation
group_scores = cross_val_score(model, X_group, y_group, cv=group_kfold, scoring='accuracy')
print(f"\nGroup K-Fold Mean Accuracy: {group_scores.mean():.4f}")
7. Repeated K-Fold and Repeated Stratified K-Fold
Detailed Explanation:
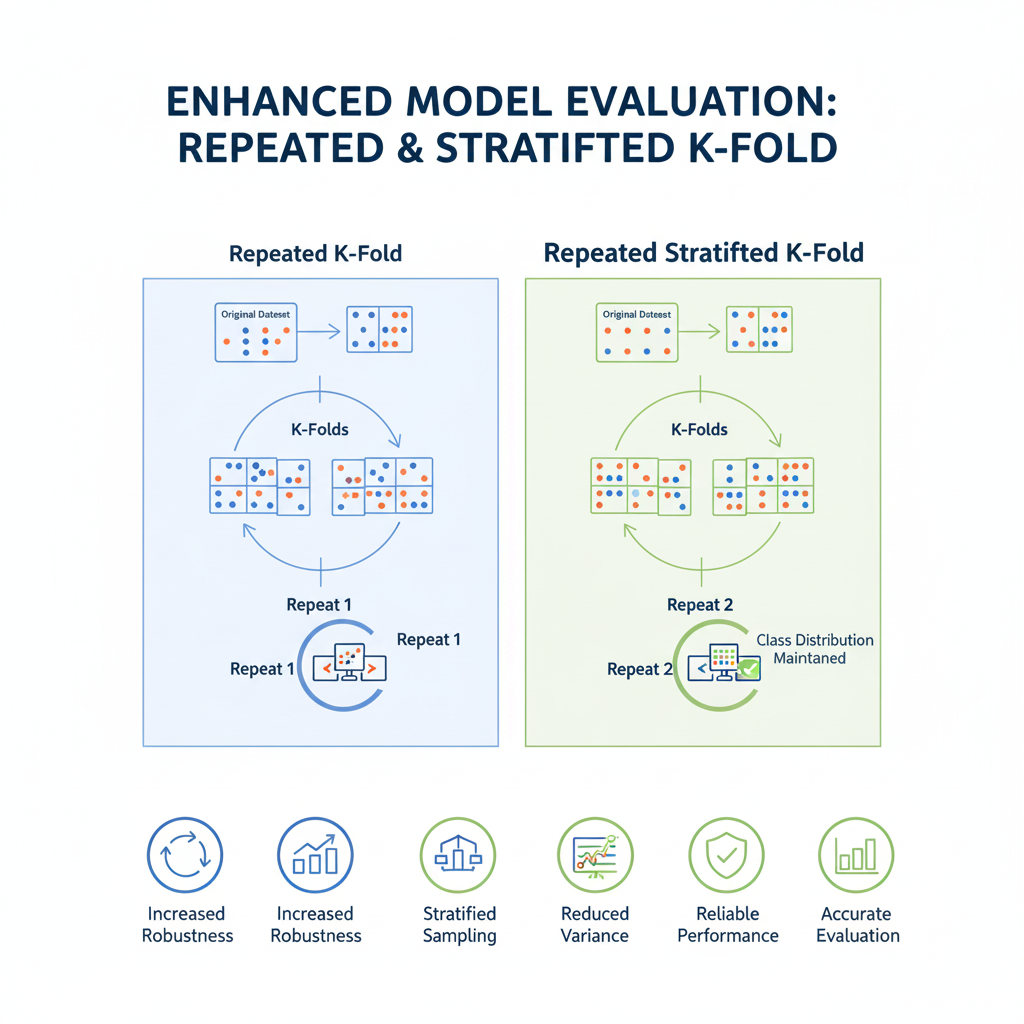
The performance estimate from a single run of K-Fold can still have some variance depending on the initial random shuffle of the data. Repeated K-Fold aims to reduce this variance further by running the entire K-Fold process multiple times, each time with a different random shuffle of the data.
The final performance estimate is the average of all the scores from all folds and all repeats. This provides an even more robust and stable estimate of model performance. RepeatedStratifiedKFold is the stratified version, which should be used for classification tasks.
How it Works:
If you specify n_splits=5 and n_repeats=10, the model will be trained and evaluated a total of 5 * 10 = 50 times. The final result is the mean and standard deviation of these 50 scores.
When to Use It:
- High-Stakes Models: When you need the most reliable and stable performance estimate possible and can afford the extra computational cost.
- Model Comparison: When comparing different models or algorithms and their performance is very close, a repeated CV can help determine if one is statistically significantly better than the other.
- Small to Medium Datasets: Where the computational cost is acceptable.
Python Implementation:
python
from sklearn.model_selection import RepeatedStratifiedKFold
from sklearn.tree import DecisionTreeClassifier

model = DecisionTreeClassifier(random_state=42)
#Cross Validation
# Standard Stratified K-Fold (for comparison)
standard_skf = StratifiedKFold(n_splits=5, shuffle=True, random_state=42)
standard_scores = cross_val_score(model, X, y, cv=standard_skf, scoring='accuracy')
print(f"Standard 5-Fold Mean Accuracy: {standard_scores.mean():.4f} (+/- {standard_scores.std() * 2:.4f})")
#Cross Validation
# Repeated Stratified K-Fold: 5 splits, repeated 10 times (50 total model fits)
repeated_skf = RepeatedStratifiedKFold(n_splits=5, n_repeats=10, random_state=42)
repeated_scores = cross_val_score(model, X, y, cv=repeated_skf, scoring='accuracy')

print(f"Repeated 5x10-Fold Mean Accuracy: {repeated_scores.mean():.4f} (+/- {repeated_scores.std() * 2:.4f})")
print(f"Number of performance estimates: {len(repeated_scores)}")
# The confidence interval (+/-) will typically be tighter for the repeated version, indicating a more stable estimate.
Part 3: Building a Practical Cross-Validation Strategy
Knowing individual techniques is necessary, but knowing how and when to apply them is what separates a proficient data scientist from an expert. A strategic approach to Cross Validation is crucial for trustworthy results.
A Practical Workflow for Model Evaluation:
- Understand Your Data:
- Is it a Time Series? If yes, use Time Series Split. There is no alternative.
- Does it have Groups? If yes (e.g., multiple samples per patient, user, or device), use Group K-Fold.
- Is it a Standard Tabular Dataset? Proceed to the next step.
- Choose Your Default Technique:
- For Classification: Start with Stratified K-Fold (n_splits=5 or 10). This should be your default 95% of the time.
- For Regression: Start with K-Fold (n_splits=5 or 10).
- Consider Data Size and Robustness:
- Very Small Datasets (<100 samples): Consider Leave-One-Out CV or Repeated K-Fold to maximize data usage and get a more stable estimate.
- Need Maximum Robustness: Use Repeated Stratified/K-Fold if computational resources allow.
- Use the Correct Scoring Metric: Always choose a metric appropriate for your problem. Accuracy is often misleading for imbalanced classification (use F1, Precision, Recall, ROC-AUC). For regression, MSE, MAE, and R² are common.
The Gold Standard: Nested Cross-Validation for Hyperparameter Tuning
A common mistake is to use the same cross-validation loop for both hyperparameter tuning and final model evaluation. This “leaks” information and can lead to an overfit model and an optimistic performance estimate. Nested CV is the correct solution.
How it Works:
- Outer Loop: Estimates the generalization error of the entire modeling process, including hyperparameter tuning. Each fold in the outer loop splits the data into a training set and a final, held-out test set.
- Inner Loop: Resides inside the outer training fold. It is used to perform hyperparameter tuning (e.g., via
GridSearchCV) on that specific training set. The best parameters found in the inner loop are used to train a model on the entire outer training set, which is then evaluated on the outer test set.
This process gives you a true estimate of how well your model (with its tuning process) will perform on unseen data.
Python Implementation of Nested CV:
python
from sklearn.model_selection import GridSearchCV
#Cross Validation
# Define the hyperparameter grid to search
param_grid = {
    'max_depth': [3, 5, 7, None],
    'min_samples_split': [2, 5, 10],
    'criterion': ['gini', 'entropy']
}

# Outer CV: for final model evaluation
outer_cv = StratifiedKFold(n_splits=5, shuffle=True, random_state=42)

# Store scores from outer loop
outer_scores = []
#Cross Validation
print("Starting Nested Cross-Validation...")
for fold, (train_idx, test_idx) in enumerate(outer_cv.split(X, y)):
    X_train, X_test = X[train_idx], X[test_idx]
    y_train, y_test = y[train_idx], y[test_idx]

    # Inner CV: for hyperparameter tuning on the outer training set
    inner_cv = StratifiedKFold(n_splits=3, shuffle=True, random_state=42)

    # Grid search with inner CV
    grid_search = GridSearchCV(
        estimator=RandomForestClassifier(random_state=42, n_estimators=50), # Using fewer trees for speed
        param_grid=param_grid,
        cv=inner_cv,
        scoring='accuracy',
        n_jobs=-1
    )
    grid_search.fit(X_train, y_train)

    # Get the best model from the inner loop
    best_model = grid_search.best_estimator_
#Cross Validation
    # Evaluate the best model on the outer test fold
    score = best_model.score(X_test, y_test)
    outer_scores.append(score)

    print(f"Fold {fold+1}: Best params {grid_search.best_params_} | Accuracy: {score:.4f}")

print(f"\nFinal Nested CV Performance: {np.mean(outer_scores):.4f} (+/- {np.std(outer_scores)*2:.4f})")
# This is your unbiased estimate of the performance of your entire modeling pipeline.
Conclusion: Validating with Confidence
Cross Validation is far more than a box-ticking exercise in a model-building pipeline; it is the very practice that separates robust, reliable machine learning from speculative guesswork. The choice of the right Cross Validation strategy is a direct reflection of your understanding of the data’s structure and the problem’s context.
To recap the strategic guide:
- Your Go-To Workhorses: Stratified K-Fold for classification and K-Fold for regression.
- The Non-Negotiable Rule: Time Series Split for any data where time matters.
- The Leakage Preventer: Group K-Fold for data with inherent groupings.
- The Robustness Enhancer: Repeated K-Fold when you need the most stable estimate.
- The Small Data Specialist: Leave-One-Out CV for tiny datasets.
- The Gold Standard for Tuning: Nested Cross-Validation to fairly evaluate a tuned model.
By mastering these techniques and, more importantly, the reasoning behind them, you empower yourself to build models that you can deploy with genuine confidence. In an era where data-driven decisions have significant consequences, rigorous validation through proper Cross Validation is not just a technical skill—it is a fundamental component of responsible and effective data science.