Introduction: The Double-Edged Sword of the Outlier
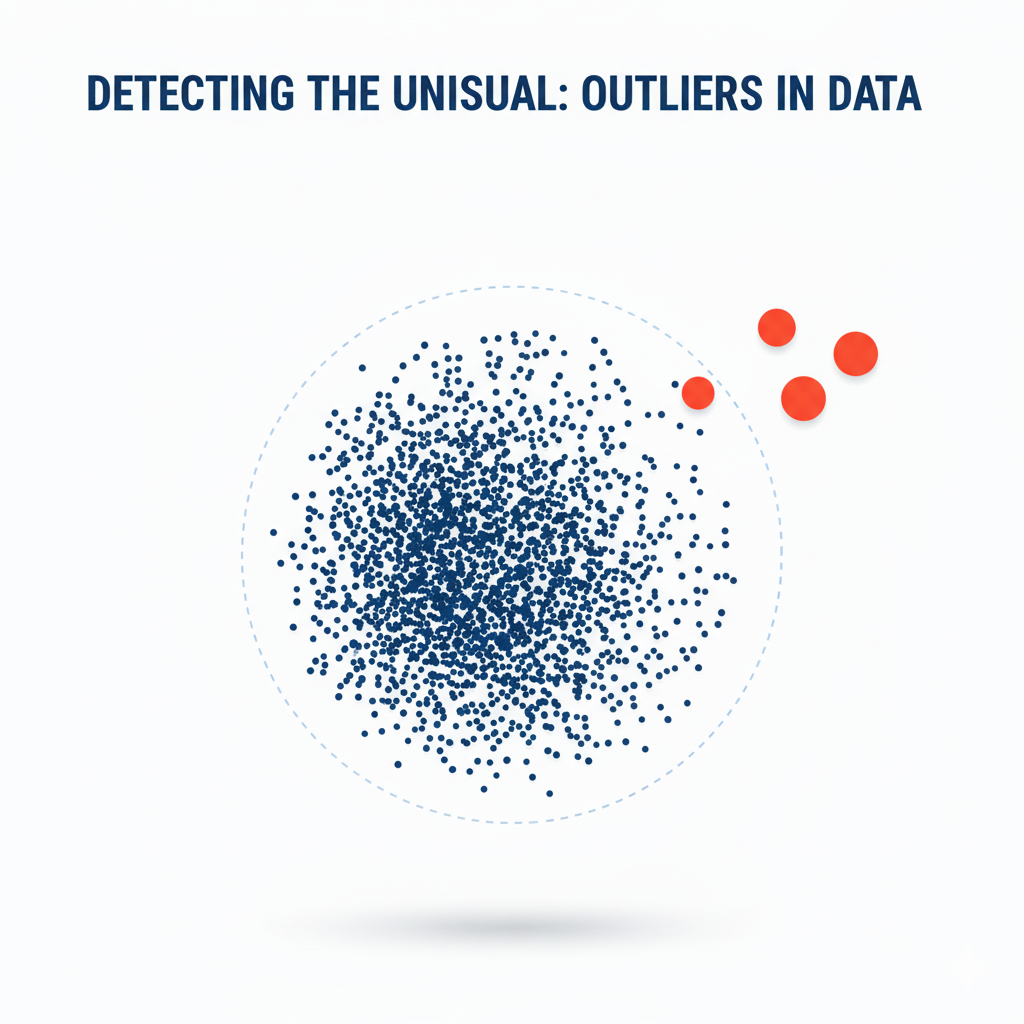
In a world increasingly governed by data, the unusual, the unexpected, and the rare hold immense power. An outlier—a data point that significantly deviates from the majority of the dataset—can be either a catastrophic error or a groundbreaking opportunity. It is the fraudulent credit card transaction hidden among millions of legitimate ones. It is the failing sensor in a complex industrial IoT network. It is the nascent customer trend that signals a multi-billion dollar market shift. It is also the data entry mistake that, if left undetected, can skew an entire business intelligence report and lead to disastrous decisions.
The fundamental challenge of the modern data era is no longer just collecting information; it’s intelligently sifting through the noise to find these critical signals. With datasets growing to petabyte scale and streaming in at velocities never seen before, the traditional method of manual, visual outlier detection is not just impractical—it’s impossible. This is where the power of automation, artificial intelligence, and big data tools comes into play.
Automated Outlier Detection is the use of sophisticated algorithms and scalable computing frameworks to identify rare items, events, or observations that raise suspicions by differing significantly from the majority of the data. This article delves into the world of automated outlier detection, exploring the core AI techniques that power it, the big data tools that enable it at scale, and the practical strategies for implementing it to protect revenue, optimize operations, and drive innovation.
Part 1: Understanding the Outlier – More Than Just a Number
Before automating detection, we must understand what we’re looking for. An outlier is not a single, well-defined concept but a phenomenon that can manifest in different ways.
1.1 Types of Outliers
- Point Outliers: A single data instance that is anomalous with respect to the rest of the data. Example: A temperature reading of 100°C in a dataset of normal body temperatures (around 37°C).
- Contextual (Conditional) Outliers: A data instance that is anomalous in a specific context. Example: A spending of $500 on clothing is normal, but it becomes an outlier if it occurs in a transaction history that only contains grocery purchases. Time is a common context (e.g., high energy usage at 3 AM is anomalous for a residential home).
- Collective Outliers: A collection of data instances that are anomalous together, even if individually they are normal. Example: A continuous, low-level cybersecurity probe from a single IP address. Each probe might be ignored, but the sequence is the real outlier.
1.2 The Impact of Outliers: Friend and Foe
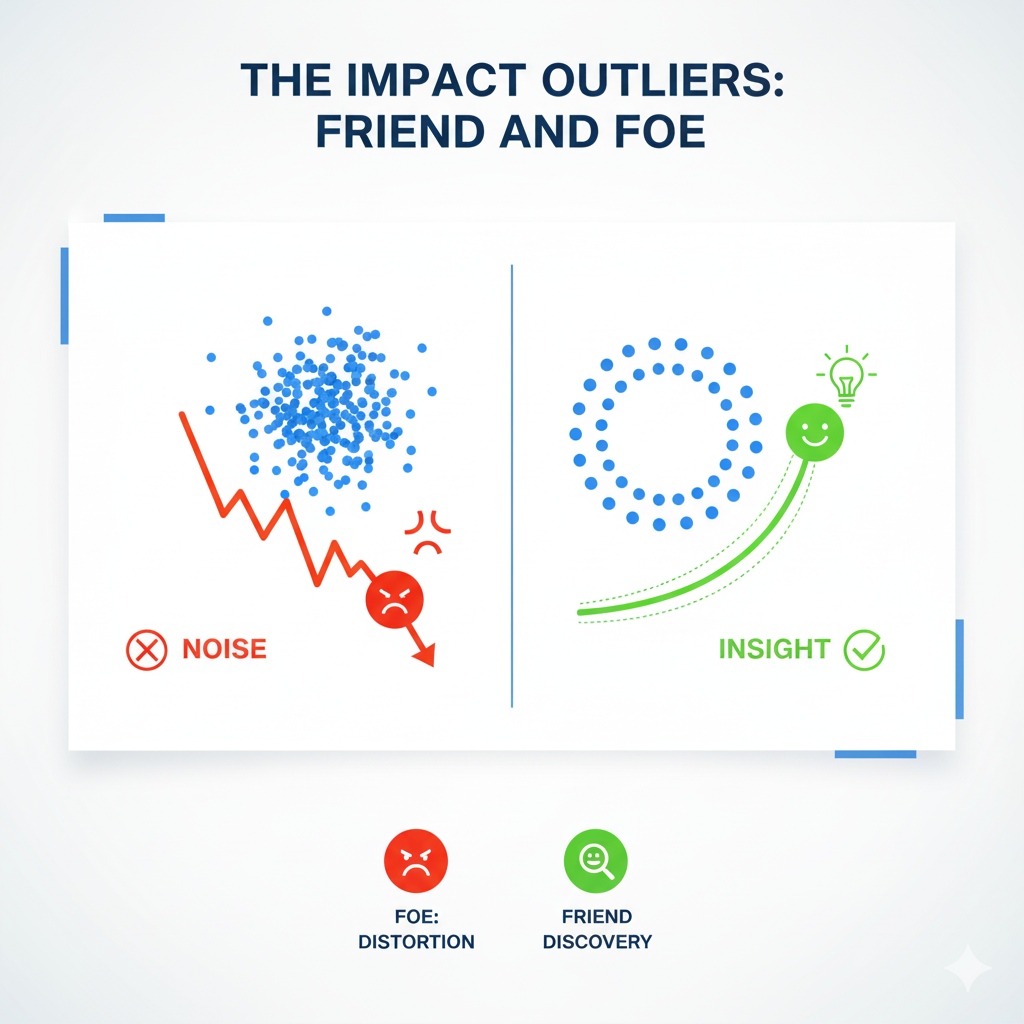
- The Foe (Why We Remove Them):
- Skewed Analysis: They can drastically bias the mean and standard deviation of a dataset, leading to incorrect conclusions.
- Model Performance: Many machine learning algorithms, especially those based on regression and distance calculations (e.g., K-Means, KNN), are highly sensitive to outliers, which can pull the model in the wrong direction and reduce its predictive accuracy.
- Data Quality: They often indicate data collection errors, sensor malfunctions, or processing bugs.
- The Friend (Why We Detect Them):
- Fraud Detection: Identifying unusual financial transactions or insurance claims.
- Intrusion Detection: Spotting malicious network activity or security breaches.
- Health Monitoring: Detecting rare diseases from medical scans or identifying anomalous patient vital signs.
- Industrial IoT: Predicting mechanical failure by identifying abnormal vibrations or temperatures in machinery.
- Novelty Discovery: Uncovering new market trends, emerging risks, or scientific discoveries.
Part 2: The AI Arsenal: Core Techniques for Automated Outlier Detection
A wide array of AI and statistical algorithms form the backbone of automated detection systems. The choice of algorithm depends on the data type, the nature of the outlier, and whether we have labeled data.
2.1 Statistical & Proximity-Based Methods (Unsupervised)
These methods do not require pre-labeled data and assume that normal data points occur in a high-probability region while outliers occur in low-probability regions.
- Z-Score / Standard Deviation: For normally distributed data, any data point that lies a certain number of standard deviations (e.g., 3) from the mean can be considered an outlier. Simple but ineffective for non-normal distributions.
- Interquartile Range (IQR): A more robust method. It defines an outlier as any value below
Q1 - 1.5*IQRor aboveQ3 + 1.5*IQR, where Q1 and Q3 are the 25th and 75th percentiles. Resistant to skewed distributions. - DBSCAN (Density-Based Spatial Clustering of Applications with Noise): A clustering algorithm that groups together densely packed points. Points that do not belong to any cluster are marked as noise (outliers). Excellent for finding outliers in data with clusters of arbitrary shape.
- Isolation Forest: Based on the principle that it is easy to isolate an outlier. It randomly selects a feature and then randomly selects a split value between the max and min of that feature. Because outliers are few and different, they are easier to “isolate” with fewer random splits. This algorithm is highly efficient and works well with high-dimensional data.
2.2 Machine Learning & Neural Networks (Semi-Supervised & Supervised)
These methods are used when we have some knowledge about what constitutes “normal” or even examples of past outliers.
- Local Outlier Factor (LOF): Measures the local deviation of a data point’s density with respect to its neighbors. A point with a significantly lower density than its neighbors is considered an outlier. This is great for detecting outliers where the density of the data is not uniform.
- One-Class SVM (Support Vector Machine): A model that learns a decision boundary around the “normal” data. Any new point falling outside this boundary is classified as an outlier. Useful when you only have examples of one class (the normal class).
- Autoencoders (Neural Networks): An unsupervised neural network trained to reconstruct its input. The network is forced to learn a compressed representation (encoding) of the data. It becomes very good at reconstructing “normal” data but struggles with “abnormal” data. A high reconstruction error indicates an outlier. This is particularly powerful for complex data like images and sequences.
Part 3: Scaling Up: Outlier Detection in the Big Data Ecosystem
Applying these algorithms to terabytes or petabytes of data requires a robust technological stack. Big Data tools provide the distributed computing power needed for automated outlier detection at scale.
3.1 Batch Processing: Finding Outliers in Historical Data
For analyzing large, static datasets stored in data lakes.
- Apache Spark MLlib: The machine learning library of Apache Spark is a workhorse for this task. It provides scalable implementations of algorithms like Isolation Forest and others. A data engineer can write a Spark job in Python (PySpark) or Scala to process terabytes of historical transaction data to build a fraud detection model.
- Workflow: Data (e.g., server logs, sales history) is stored in a distributed file system like HDFS or cloud storage (S3). A scheduled Spark job runs the detection algorithm, and the results (the flagged outliers) are written to a database or data warehouse for investigation.
3.2 Stream Processing: Real-Time Outlier Detection
For identifying outliers the moment they occur in a continuous data stream.
- Apache Kafka + Apache Flink / Kafka Streams: Kafka acts as the central nervous system, ingesting high-velocity data from sources like website clicks, IoT sensors, or financial feeds. Stream processing frameworks like Flink then apply detection models to this data in real-time.
- Real-World Example (IoT): A wind farm has thousands of sensors on its turbines. A Kafka topic ingests vibration data. A Flink application continuously calculates a moving Z-score for each sensor. If the vibration for a specific turbine exceeds 5 standard deviations from its recent mean, an alert is triggered for immediate maintenance, preventing a costly failure.
3.3 End-to-End Platforms
Cloud providers offer managed services that simplify the entire pipeline.
- Amazon SageMaker: Offers built-in, high-performance implementations of Random Cut Forest (an outlier detection algorithm) and more, which can be used for both batch and real-time inference.
- Microsoft Azure Anomaly Detector: A dedicated API service that can be called directly from applications to detect anomalies in time-series data without needing to build models from scratch.
- Google Cloud AI Platform: Allows for building, deploying, and scaling custom outlier detection models using frameworks like TensorFlow and scikit-learn on Google’s infrastructure.
Part 4: Building a Robust Automated Detection System – A Practical Framework
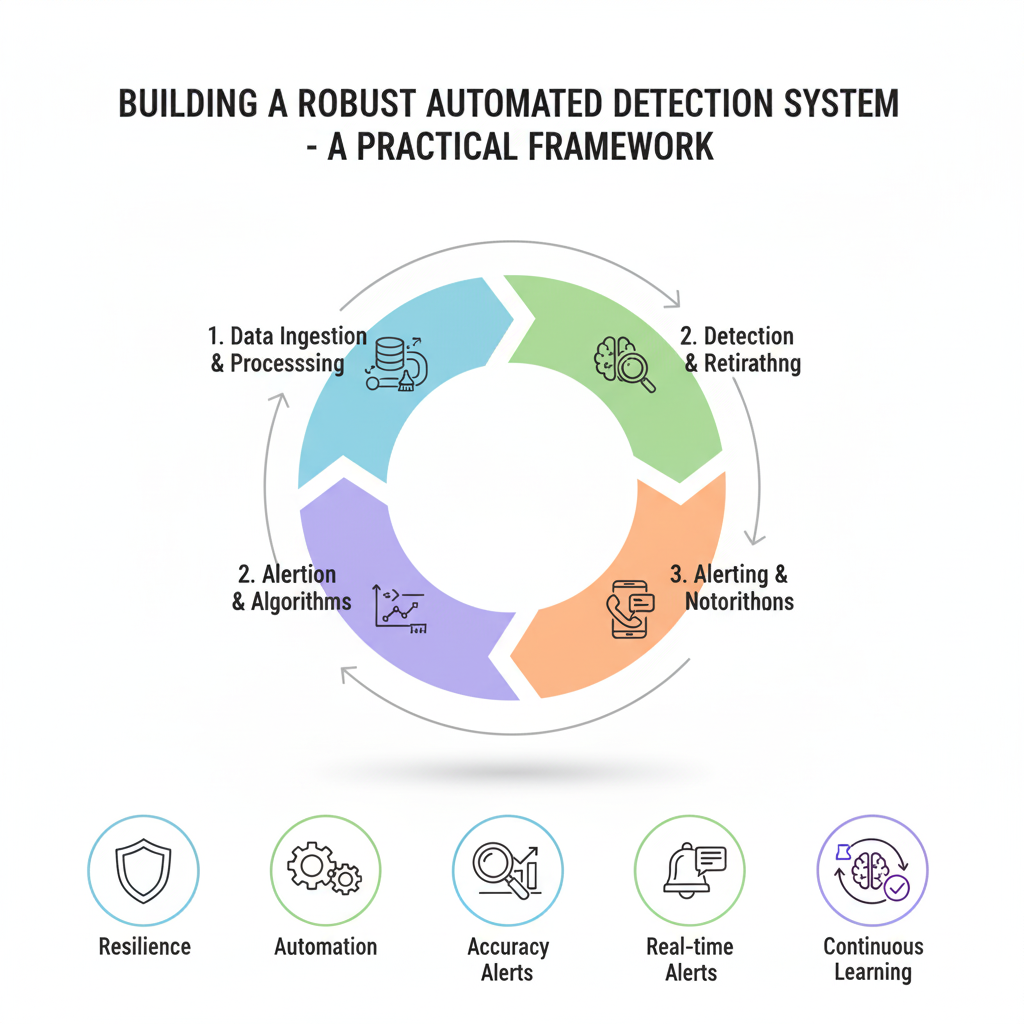
Implementing a successful system involves more than just choosing an algorithm. It requires a thoughtful, end-to-end strategy.
4.1 The System Development Lifecycle
- Problem Formulation & Context: The most critical step. Are we looking for point, contextual, or collective outliers? What is the business cost of a false positive (flagging a normal point) versus a false negative (missing a true outlier)? Defining this guides all subsequent choices.
- Data Preparation & Feature Engineering: Garbage in, garbage out. This involves:
- Normalization/Scaling: Crucial for distance-based algorithms.
- Handling Missing Values.
- Creating Contextual Features: For time-series data, create features like “time of day,” “day of week,” or rolling averages.
- Algorithm Selection & Training: Choose an algorithm based on the problem definition (see Part 2). For unsupervised methods, “training” involves fitting the model to the data to learn its structure. For supervised methods, it requires a labeled dataset of normal and outlier examples.
- Evaluation & Tuning: Since outliers are rare, accuracy is a misleading metric. Use precision, recall, and especially the F1-Score.
- Precision: Of all the points we flagged as outliers, how many were actually outliers? (Minimizes false alarms).
- Recall: Of all the true outliers in the dataset, how many did we successfully find? (Minimizes missed outliers).
- A business must decide on the trade-off between these two. A fraud detection system might prioritize high recall (catch all fraud, even if it means some false alarms), while a system for recommending products might prioritize high precision (only show the most relevant suggestions).
- Deployment & Monitoring: Deploy the model into a production pipeline (batch or streaming). Crucially, models must be monitored for concept drift—the phenomenon where the definition of “normal” changes over time, causing the model’s performance to decay. This necessitates periodic retraining.
Part 5: The Human-in-the-Loop: Why Automation Isn’t Autonomous
Fully automated systems that delete outliers without human oversight are dangerous. The most effective systems are automated for scale but designed for human collaboration.
- The Feedback Loop: Flagged outliers should be sent to a dashboard for human experts to review. A security analyst investigates a potential intrusion. A data scientist validates a strange cluster of data. Their feedback (e.g., “This was a real threat,” “This was a false alarm”) becomes valuable labeled data that can be used to retrain and improve the model in a supervised fashion.
- Interpretability: A model that simply flags an ID as an outlier is not useful. The system must provide reasoning. Techniques like SHAP (SHapley Additive exPlanations) can explain why a particular instance was flagged as anomalous—for example, “This transaction was flagged because the amount was 10x the user’s average and occurred in a foreign country.” This context is essential for a human to make a quick, informed decision.
Part 6: Advanced Architectures for Modern Data Environments
As data ecosystems grow more complex, traditional detection methods must evolve. Modern architectures integrate multiple approaches to handle diverse data types and operational requirements.
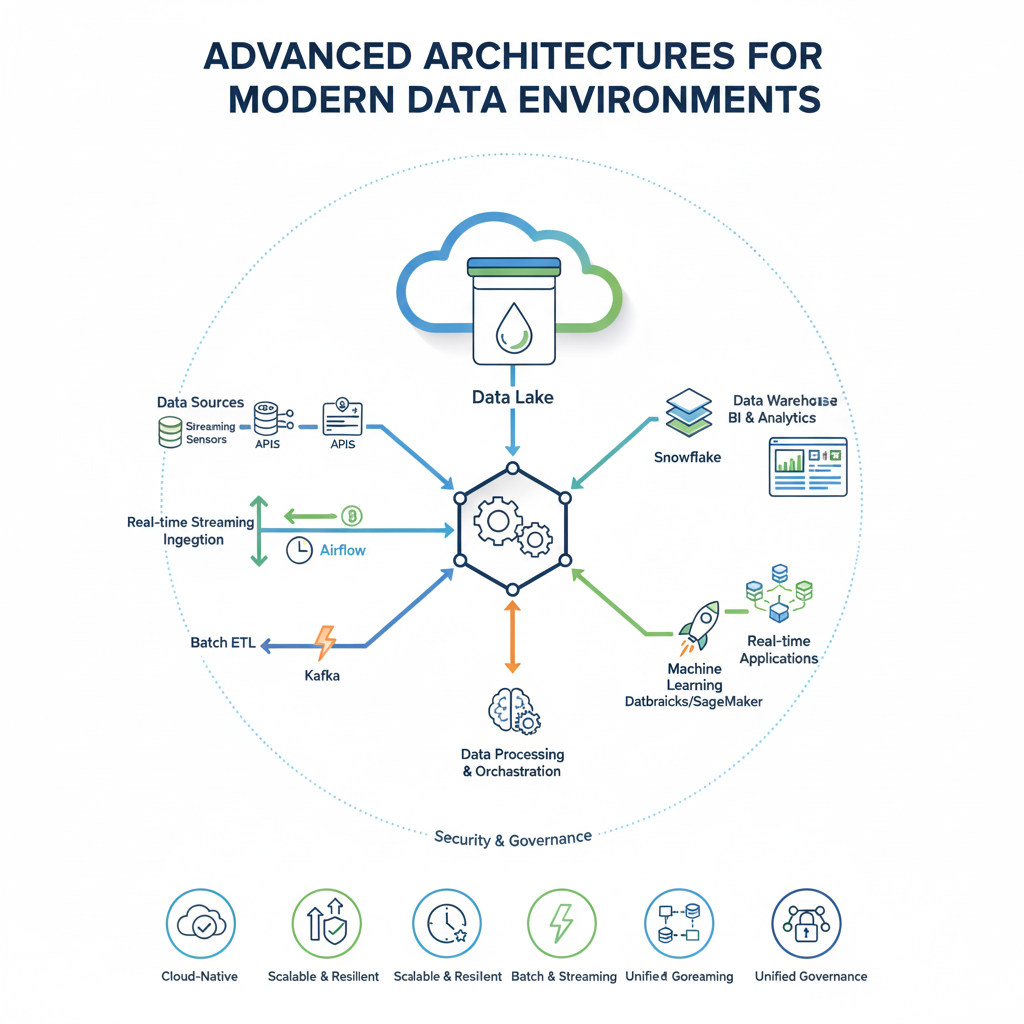
Hybrid Detection Frameworks
Sophisticated systems now combine multiple detection strategies to improve accuracy and reduce false positives. A typical hybrid framework might include:
- Real-time streaming layer for immediate flagging of extreme deviations
- Batch processing layer for deeper pattern analysis
- Ensemble methods that combine outputs from different algorithms
- Context-aware filtering that applies business rules to algorithm outputs
Multi-Modal Detection Systems
Modern data environments contain diverse data types that require specialized approaches:
- Time-series analysis for temporal patterns and seasonal anomalies
- Image and video analysis using convolutional neural networks
- Text analytics for unusual language patterns or content
- Graph-based detection for network behavior and relationship anomalies
These systems often employ transformer architectures and attention mechanisms to weigh different signals appropriately, creating a unified view of unusual activity across all data modalities.
Part 7: Implementation Challenges and Strategic Considerations
Deploying effective detection systems requires navigating several practical challenges that go beyond technical implementation.
Data Quality and Preparation
The foundation of any detection system is clean, well-structured data. Common challenges include:
- Missing values that can create false signals or mask real issues
- Data drift where statistical properties change over time
- Label inconsistency when multiple systems define normal behavior differently
- Feature engineering to create meaningful indicators of unusual activity
Resource and Performance Optimization
Balancing detection accuracy with computational efficiency requires careful planning:
- Sampling strategies for handling extremely large datasets
- Feature selection to reduce dimensionality while maintaining signal
- Model compression for deployment in resource-constrained environments
- Caching strategies for frequently accessed reference patterns
Organizational Alignment
Successful implementation depends on cross-functional collaboration:
- Clear ownership of detection rules and response procedures
- Stakeholder education about system capabilities and limitations
- Process integration with existing workflows and escalation paths
- Performance metrics that align with business objectives
Part 8: Case Studies Across Industries
Real-world applications demonstrate how organizations leverage advanced detection capabilities to solve business-critical problems.
Financial Services Implementation
A global bank deployed a multi-layered detection system for transaction monitoring:
- Real-time layer flags transactions exceeding dynamic thresholds based on customer history
- Batch analysis identifies subtle patterns across multiple accounts
- Network analysis detects coordinated activity across seemingly unrelated entities
The system reduced false positives by 40% while identifying 15% more actual fraud cases, significantly improving both security and customer experience.
Manufacturing and Predictive Maintenance
An automotive manufacturer implemented sensor-based detection across its production lines:
- Vibration analysis identifies equipment degradation before failure
- Thermal pattern recognition detects emerging issues in manufacturing processes
- Supply chain monitoring flags component quality issues from suppliers
This approach reduced unplanned downtime by 60% and improved overall equipment effectiveness by 25%.
Healthcare and Patient Safety
A hospital network developed a patient monitoring system that:
- Analyzes vital sign trends to detect early warning signs of deterioration
- Monitors medication administration for potential errors
- Tracks equipment usage patterns for maintenance forecasting
The system helped reduce adverse events by 30% and improved resource allocation across clinical departments.
Part 9: Emerging Trends and Future Directions
The field of automated detection continues to evolve rapidly, driven by advances in AI and changing business needs.
Explainable AI and Interpretability
There’s growing emphasis on making detection systems more transparent:
- Causal inference models that explain why something is unusual
- Counterfactual explanations showing what would make a case normal
- Interactive visualization tools for exploring detection results
- Natural language explanations that describe findings in business terms
Federated and Privacy-Preserving Approaches
New architectures address data privacy concerns while maintaining detection capabilities:
- Federated learning where models train across distributed data sources
- Differential privacy that adds calibrated noise to protect individual records
- Homomorphic encryption that allows computation on encrypted data
- Edge computing that processes sensitive data locally
Adaptive and Self-Learning Systems
Next-generation systems are becoming more autonomous and responsive:
- Continuous learning from new data and feedback
- Automated model retraining and performance monitoring
- Dynamic threshold adjustment based on changing conditions
- Transfer learning between different domains and use cases
Part 10: Building a Sustainable Detection Practice
Creating lasting value from detection capabilities requires focusing on long-term sustainability and organizational learning.
Governance and Lifecycle Management
Effective practices include:
- Model registry for tracking versions and performance
- Drift monitoring to detect decreasing effectiveness
- Regular validation against new data and business requirements
- Retirement protocols for outdated approaches
Measuring Business Impact
Beyond technical metrics, organizations should track:
- Cost savings from prevented incidents and optimized processes
- Revenue protection from early risk identification
- Operational efficiency gains from automated monitoring
- Strategic advantage from identifying new opportunities
Cultivating Detection Literacy
Building organizational capability involves:
- Training programs for different stakeholder groups
- Clear communication of system capabilities and limitations
- Feedback mechanisms for continuous improvement
- Success stories that demonstrate value to the organization
Ethical Considerations and Responsible Use
As detection capabilities grow more powerful, organizations must consider:
- Bias mitigation to ensure fair treatment across different groups
- Proportional response to findings based on confidence levels
- Transparency about monitoring and detection practices
- Human oversight for significant decisions and appeals processes
By addressing these broader considerations, organizations can build detection capabilities that not only solve immediate problems but also create lasting competitive advantage and operational resilience. The most successful implementations balance technical sophistication with practical business understanding, creating systems that are both powerful and trustworthy.
Conclusion: From Anomaly to Advantage
In the vast digital landscapes of the 21st century, the ability to automatically and intelligently detect outliers is no longer a luxury—it is a core competency. It is the key to building resilient systems, creating secure environments, and maintaining data integrity. More than that, it is a lens for focused innovation, allowing organizations to spot the weak signals that precede major shifts.
By combining the sophisticated AI techniques for outlier detection with the immense scaling power of big data tools, businesses can move from being reactive to being proactive. They can stop fraud before money is stolen, fix machinery before it breaks, and capitalize on trends before competitors even notice them. The automated detection of the outlier is the process of separating the signal from the noise, transforming random anomalies into a strategic advantage.