Understand regression vs classification: regression predicts continuous values, classification predicts categories. Learn key differences, when to use each approach, and practical implementation tips
Introduction: Understanding the Fundamental Divide in Machine Learning
Regression and classification represent the two fundamental pillars of supervised machine learning, yet confusion between these concepts persists among both beginners and experienced practitioners. The distinction between regression and classification is not merely academic—it determines everything from algorithm selection and model evaluation to business interpretation and decision-making. In the rapidly evolving landscape of artificial intelligence, where organizations invested over $189 billion in AI solutions in 2023 alone, understanding when to apply regression versus classification becomes crucial for building effective machine learning systems.
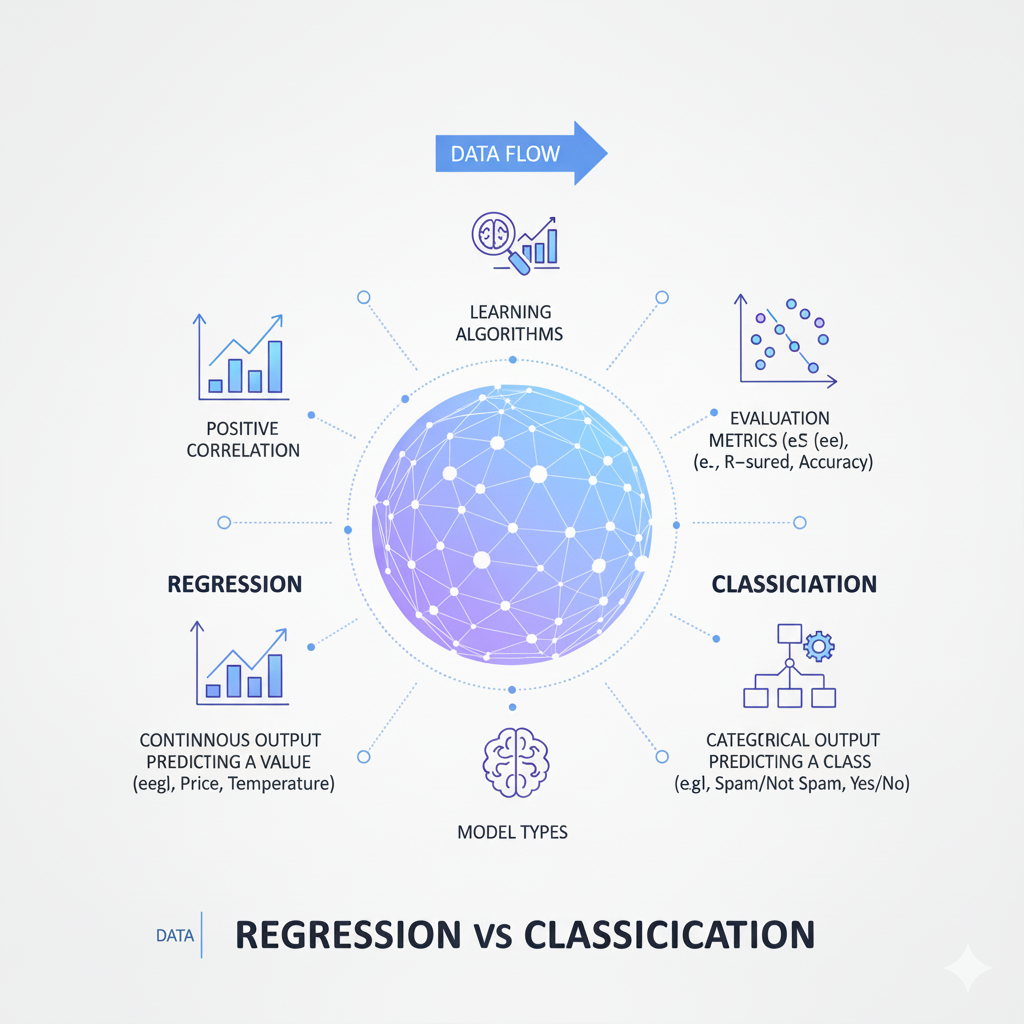
At its core, the difference between regression and classification boils down to the nature of the target variable we’re trying to predict. Regression deals with continuous numerical outcomes—predicting quantities, amounts, or values that can exist on a spectrum. Classification, in contrast, predicts discrete categorical outcomes—assigning observations to distinct groups or categories. This fundamental distinction might seem straightforward, but its implications ripple through every aspect of the machine learning workflow, from data preparation and feature engineering to model deployment and monitoring.
This comprehensive guide simplifies the key differences between regression and classification, providing clear explanations, practical examples, and decision frameworks that will help you choose the right approach for your specific machine learning problems. Whether you’re predicting customer spending (regression) or classifying customer segments (classification), understanding these concepts will improve your model performance and ensure you’re using the right tools for your analytical objectives.
What is Regression? Predicting Continuous Values
The Essence of Regression Analysis
Regression is a statistical method used to predict continuous numerical values based on the relationship between variables. When we perform regression, we’re essentially answering “how much” or “how many” questions. The output of a regression model is a number that can theoretically take any value within a range, allowing for fine-grained predictions and measurements.
The mathematical foundation of regression involves finding the function that best maps input features to a continuous target variable. In simple linear regression, this takes the form of y = mx + b, where we predict a continuous outcome y based on a single feature x. In multiple regression, we extend this to y = b₀ + b₁x₁ + b₂x₂ + … + bₙxₙ, using multiple features to predict our target variable. The “learning” in regression involves finding the parameters (coefficients) that minimize the difference between predicted and actual values.
Regression models are evaluated based on how close their predictions are to the actual values. Common evaluation metrics include:
- Mean Absolute Error (MAE): The average absolute difference between predictions and actual values
- Mean Squared Error (MSE): The average squared difference, which penalizes larger errors more heavily
- R-squared: The proportion of variance in the target variable explained by the model
Real-World Regression Examples
Regression problems appear across virtually every industry and domain. Here are some common examples:
Business and Economics:
- Predicting house prices based on location, size, and features
- Forecasting sales revenue using historical data and market indicators
- Estimating customer lifetime value from purchase history and engagement metrics
Healthcare:
- Predicting patient recovery time based on treatment type and health indicators
- Estimating medication dosage requirements using patient characteristics
- Forecasting disease progression based on symptoms and test results
Technology:
- Predicting server load based on user traffic patterns
- Estimating battery life for mobile devices using usage patterns
- Forecasting website traffic growth from historical data and marketing campaigns
Manufacturing:
- Predicting equipment failure time based on sensor readings
- Estimating production output using operational parameters
- Forecasting material requirements from production schedules
In each case, the common thread is predicting a continuous numerical value that can be measured and compared on a scale. The predictions have magnitude and direction—we can say one prediction is higher or lower than another, and by how much.
What is Classification? Predicting Categories
The Nature of Classification Problems
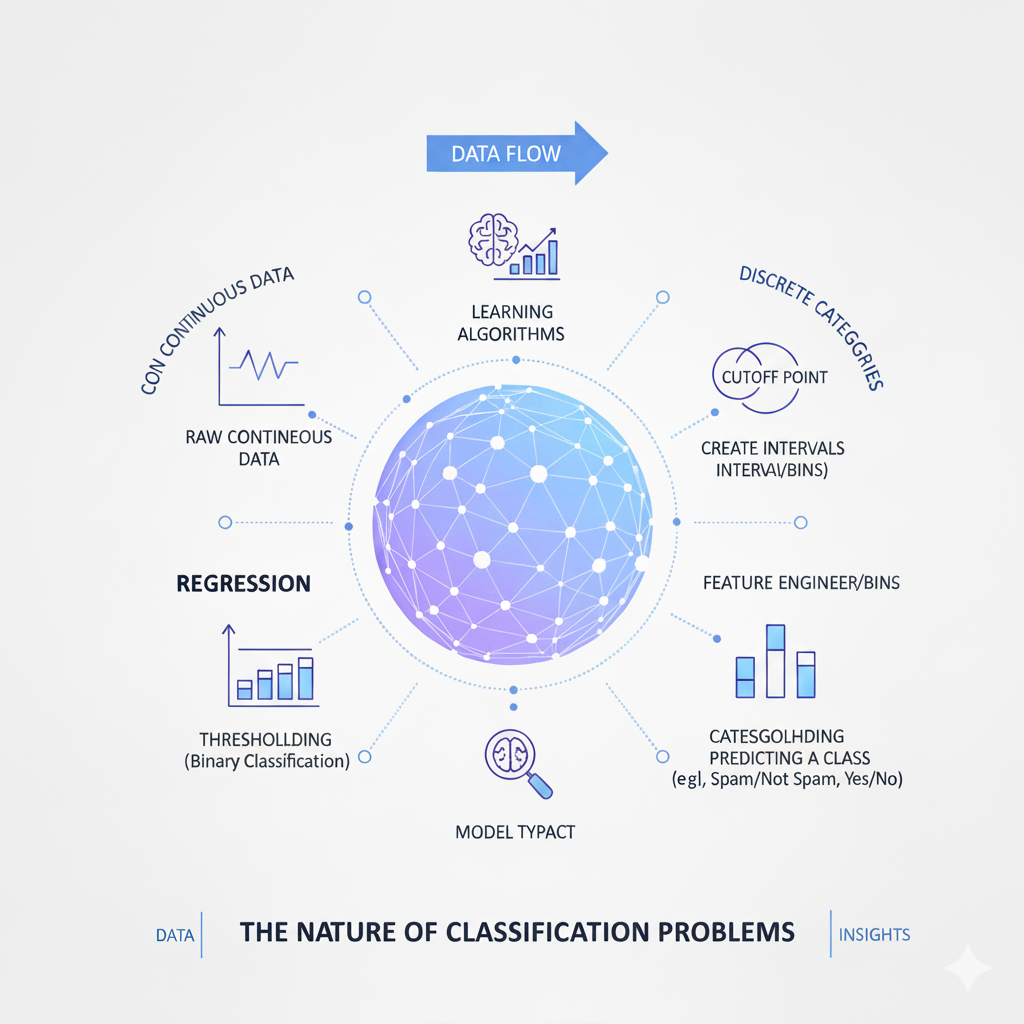
Classification involves predicting discrete class labels or categories. Instead of asking “how much,” classification answers “what type” or “which category” questions. The output of a classification model is a probability distribution over possible classes or a direct assignment to a specific category.
Unlike regression where outputs exist on a continuous spectrum, classification deals with distinct, mutually exclusive groups. These categories can be binary (two possible outcomes) or multiclass (multiple possible outcomes). The key characteristic is that the outputs are qualitative rather than quantitative—they represent types or kinds rather than amounts.
The mathematical approach to classification often involves estimating probabilities for each possible class and then selecting the most likely category. For binary classification, this might involve using a sigmoid function to estimate the probability of belonging to the positive class. For multiclass problems, the softmax function generalizes this approach to multiple categories. The decision boundary—the surface that separates different classes in the feature space—is a fundamental concept in classification.
Classification models are evaluated based on their ability to correctly assign categories:
- Accuracy: The proportion of correct predictions overall
- Precision and Recall: Tradeoffs between different types of errors
- F1-Score: The harmonic mean of precision and recall
- Confusion Matrix: A detailed breakdown of prediction types
Real-World Classification Examples
Classification problems are equally prevalent across domains:
Business and Marketing:
- Classifying emails as spam or not spam
- Predicting customer churn (will leave or stay)
- Categorizing products into different market segments
Healthcare:
- Diagnosing diseases based on symptoms and test results
- Classifying tumor malignancy from medical images
- Predicting patient readmission risk (high, medium, low)
Technology:
- Sentiment analysis of text (positive, negative, neutral)
- Image recognition and object classification
- Fraud detection in financial transactions
Social Sciences:
- Predicting voting behavior based on demographic data
- Classifying research articles into academic disciplines
- Identifying personality types from behavioral data
In classification, the focus is on correctness of category assignment rather than precision of numerical prediction. The question isn’t “how much will this customer spend?” but “will this customer make a purchase?”
Key Differences Simplified
Problem Nature and Output Type
The most fundamental difference lies in what we’re predicting:
Regression:
- Predicts continuous values
- Outputs are numbers that can be measured and compared
- Examples: $245,000, 15.7 days, 82.3 points
- Answers “how much?” or “how many?” questions
Classification:
- Predicts discrete categories
- Outputs are labels or classes
- Examples: “spam”, “high risk”, “category A”
- Answers “which type?” or “what category?” questions
This distinction matters because continuous outputs allow for more nuanced decisions. A regression prediction of $247,500 versus $250,000 for a house price gives meaningful information about the magnitude of difference. A classification prediction of “expensive” versus “affordable” loses this granularity.
Algorithm Selection and Approach
The type of problem dictates which algorithms are appropriate:
Common Regression Algorithms:
- Linear Regression: Models linear relationships between features and target
- Decision Tree Regressors: Non-linear models that partition feature space
- Random Forest Regressors: Ensemble method combining multiple trees
- Gradient Boosting Regressors: Sequential improvement of predictions
- Neural Networks: Flexible function approximators for complex relationships
Common Classification Algorithms:
- Logistic Regression: Despite the name, used for classification via probability estimation
- Decision Tree Classifiers: Similar to regression trees but with class predictions
- Random Forest Classifiers: Ensemble method for classification tasks
- Support Vector Machines: Finds optimal boundaries between classes
- Neural Networks: Can be adapted for classification with appropriate output layers
Some algorithms can be adapted for both tasks (like decision trees and neural networks), while others are specific to one domain. The key is that regression algorithms are designed to minimize distance from actual values, while classification algorithms focus on maximizing separation between classes.
Evaluation Metrics and Interpretation
How we measure success differs dramatically:
Regression Evaluation:
- Error-based metrics: Measure how far predictions are from actual values
- MAE: Interpretable in original units (e.g., dollars, days)
- MSE: Emphasizes larger errors, useful for optimization
- R²: Proportion of variance explained, scale-independent
Classification Evaluation:
- Accuracy-based metrics: Measure correctness of category assignments
- Accuracy: Overall correctness rate
- Precision: When we predict positive, how often are we correct?
- Recall: How many actual positives do we catch?
- F1-Score: Balances precision and recall
The choice of metric depends on business context. In regression, a $1,000 error might be significant for a $10,000 prediction but trivial for a $1,000,000 prediction. In classification, the cost of different types of errors (false positives vs false negatives) often determines which metrics matter most.
When to Use Regression vs Classification
Decision Framework
Choosing between regression and classification starts with understanding your business problem:
Use Regression When:
- You need to predict a quantity or amount
- The output exists on a continuous scale
- Small differences in prediction magnitude matter
- You want to understand relationships between variables numerically
- Examples: forecasting demand, estimating costs, predicting time
Use Classification When:
- You need to assign categories or labels
- The output is naturally discrete
- You’re making yes/no or either/or decisions
- You want to understand what features distinguish categories
- Examples: spam detection, disease diagnosis, customer segmentation
Problem Transformation
Sometimes, the same underlying business problem can be framed as either regression or classification:
Example: Customer Value
- Regression: Predict exact customer lifetime value ($1,245, $2,780, etc.)
- Classification: Categorize customers as “high,” “medium,” or “low” value
Example: Risk Assessment
- Regression: Predict probability of default (0.15, 0.23, 0.07, etc.)
- Classification: Classify as “high risk” or “low risk”
The choice depends on how the predictions will be used. If you need precise amounts for budgeting or resource allocation, regression is better. If you’re making categorical decisions (approve/deny, target/ignore), classification may suffice.
Technical Implementation Differences
Data Preparation and Feature Engineering
While both regression and classification benefit from careful data preparation, some aspects differ:
Common to Both:
- Handling missing values
- Feature scaling for distance-based algorithms
- Encoding categorical features
- Detecting and treating outliers
Regression-Specific Considerations:
- Target variable scaling may be necessary
- Outliers in the target variable can significantly impact models
- Feature interactions may need explicit modeling
- Time series considerations for temporal data
Classification-Specific Considerations:
- Class imbalance may require sampling techniques
- Categorical target encoding (one-hot, label encoding)
- Decision threshold tuning for probability outputs
- Cost-sensitive learning for unequal error costs
Model Interpretation and Business Impact
How we explain and use models differs:
Regression Interpretation:
- Coefficients represent expected change in target per unit change in feature
- Predictions have direct numerical interpretation
- Confidence intervals provide range of likely values
- Example: “Each additional bedroom increases price by $15,000 ± $2,000”
Classification Interpretation:
- Feature importance indicates predictive power for class separation
- Probability scores indicate confidence in class assignment
- Decision boundaries show where classifications change
- Example: “Age > 65 and income < $40,000 predicts high churn risk”
The business impact also differs. Regression errors have magnitude—being wrong by $100 versus $10,000 matters. Classification errors are often binary—right or wrong—though the costs of different error types may vary.
Advanced Considerations
Algorithm Flexibility and Hybrid Approaches
Some algorithms naturally handle both regression and classification:
Decision Trees:
- Regression trees: Predict continuous values at leaves
- Classification trees: Predict class labels at leaves
- Same splitting logic, different prediction types
Neural Networks:
- Regression: Linear output layer, continuous activation
- Classification: Softmax output layer, categorical predictions
- Same architecture principles, different output layers
Ensemble Methods:
- Random Forests and Gradient Boosting have both regression and classification versions
- Same ensemble concept, different base learners
Thresholding and Binning
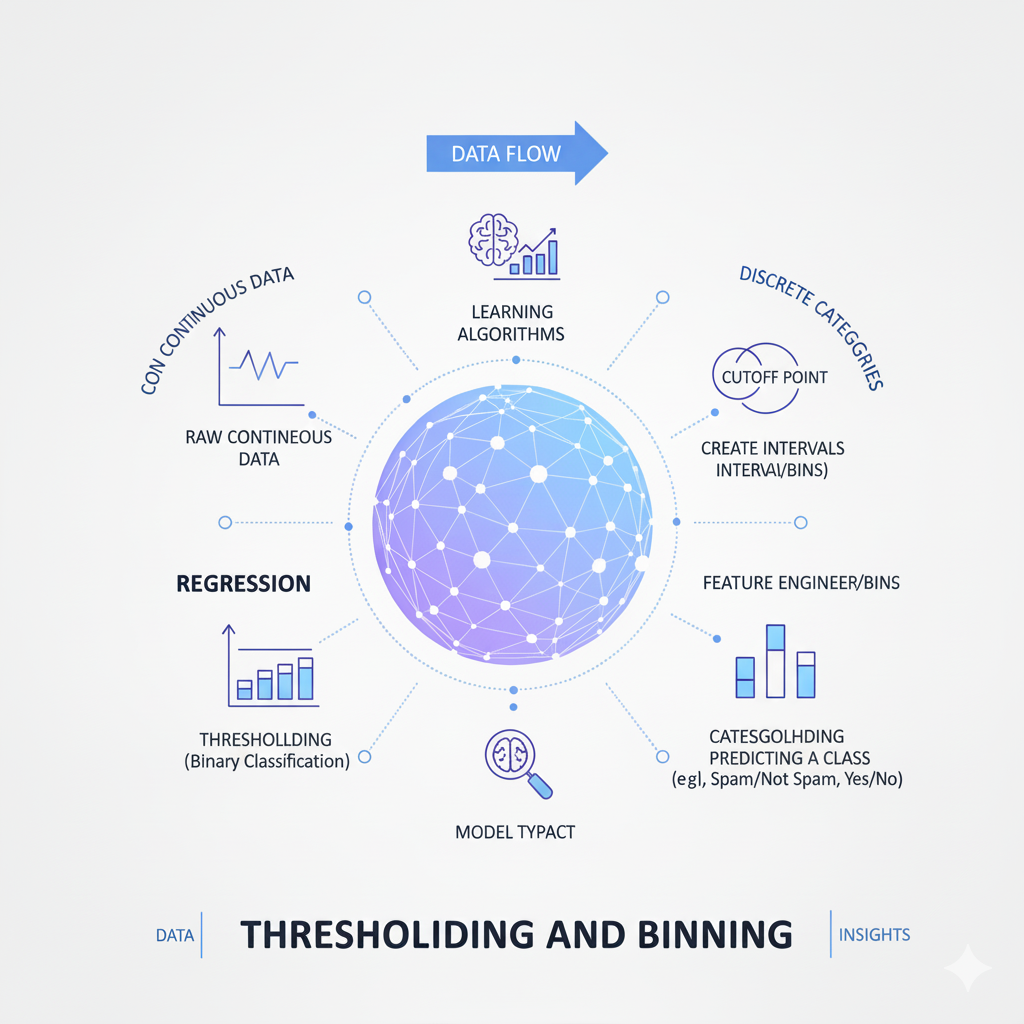
Sometimes we convert between regression and classification:
Regression to Classification:
- Apply thresholds to continuous predictions
- Example: Convert probability scores to class labels using a decision threshold
- Risk: Loss of information and nuance
Classification to Regression:
- Use class probabilities as continuous scores
- Example: Use “probability of premium customer” as a continuous value
- Benefit: Retains some granularity while working with categories
Best Practices and Common Pitfalls
Avoiding Common Mistakes
Misapplying Algorithms:
- Using classification algorithms for regression problems
- Applying regression to categorical outcomes
- Solution: Always verify your problem type before selecting algorithms
Ignoring Problem Context:
- Choosing based on technical convenience rather than business needs
- Overlooking how predictions will be used in decision-making
- Solution: Start with the business problem, then select the technical approach
Evaluation Mismatch:
- Using classification metrics for regression problems
- Applying regression metrics to classification tasks
- Solution: Match evaluation metrics to your problem type
Practical Implementation Tips
Start Simple:
- Begin with linear regression or logistic regression as baselines
- Understand the limitations of simple models before moving to complex ones
- Use interpretable models when explanation matters
Validate Assumptions:
- For regression: Check linearity, normality, homoscedasticity
- For classification: Verify class separation, check for imbalance
- Use diagnostic plots and statistical tests
Consider Business Constraints:
- Regression: What error magnitude is acceptable?
- Classification: What are the costs of different error types?
- Align technical metrics with business objectives
Conclusion: Choosing the Right Tool for the Job
Detailed Analysis: The Foundational Distinction Between Regression and Classification
The conclusion you’ve provided encapsulates the core strategic understanding needed to apply machine learning effectively. Let’s dissect it to reveal the profound implications of this distinction on every aspect of a project.
1. The Nature of the Question: “How Much” vs. “What Type”
This is the absolute bedrock of the distinction. The type of question you ask dictates the entire machine learning pathway.
- Regression: The World of Continuous Quantities
- Core Concept: Regression models predict a number. This number exists on a continuous scale, meaning the differences between values are meaningful and measurable.
- Deep Implication: Because the output is continuous, the model’s performance is judged on the magnitude of its error. Being “a little wrong” is different from being “very wrong.” A model predicting a house price that’s off by $10,000 is significantly better than one that’s off by $100,000, even if both are technically “incorrect.”
- Real-World Analogies:
- Forecasting: “How much sales revenue will we generate next quarter?” (Output: $2.45 Million)
- Estimation: “How many minutes will this machine part last before failing?” (Output: 1,250 hours)
- Measurement: “Based on this chest X-ray, what is the patient’s exact bone density score?” (Output: 0.82 g/cm²)
- Classification: The World of Discrete Categories
- Core Concept: Classification models assign a label. The output is a category from a predefined list. These categories are distinct and separate; you cannot be “between” them.
- Deep Implication: Performance is judged on correctness of assignment, not the size of an error. The result is often binary: right or wrong. However, the cost of different types of errors (e.g., a false positive vs. a false negative) can be vastly different.
- Real-World Analogies:
- Diagnosis: “Is this tumor malignant or benign?” (Output:
Malignant) - Identification: “What species of flower is in this image?” (Output:
Iris Setosa) - Filtering: “Is this email spam or not spam?” (Output:
Spam)
- Diagnosis: “Is this tumor malignant or benign?” (Output:
2. The Ripple Effect on the Machine Learning Workflow
The initial choice between regression and classification creates a cascade of subsequent decisions that shape the entire project.
| Workflow Stage | Impact of Choosing Regression | Impact of Choosing Classification |
|---|---|---|
| Algorithm Selection | You select from algorithms designed to minimize a continuous error. • Linear Regression • Decision Tree Regressor • Random Forest Regressor | You select from algorithms designed to find boundaries between classes. • Logistic Regression (for probability) • Support Vector Machines (SVM) • Random Forest Classifier |
| Data Preparation | The target variable is a number you may need to scale. Outliers in the target variable can severely skew the model. | The target variable is a label you must encode (e.g., “cat” -> 0, “dog” -> 1). You must handle class imbalance (e.g., 1000 “not spam” vs. 10 “spam” emails). |
| Model Evaluation | You use metrics that measure distance from the true value. • Mean Absolute Error (MAE): “On average, our house price predictions are off by $15,000.” • R-squared: “Our model explains 85% of the variance in sales data.” | You use metrics based on correct/incorrect assignments. • Accuracy: “We correctly classified 94% of emails.” • Precision & Recall: “When we say ‘spam’, we are correct 99% of the time (Precision), and we catch 90% of all spam emails (Recall).” |
| Business Interpretation | The output is directly actionable as a quantity. Example: A prediction of “inventory needed = 1,250 units” can be sent directly to the procurement team. | The output triggers a specific decision or action. Example: A prediction of “transaction = fraudulent” triggers a transaction block and a customer alert. |
3. The Strategic Choice: Driven by Business Needs
This is the most critical takeaway: the choice is not about which model is more “advanced,” but about what the business actually needs to do with the prediction.
- When to Lean Towards Regression: The Need for Precision and Measurement
- Use Case: You require a precise, numerical estimate for planning, optimization, or resource allocation.
- Scenario: A logistics company needs to predict the exact delivery time in hours for each truck on its route. A classification model that outputs “On-Time” vs. “Delayed” is useless here. They need the number to manage schedules, allocate resources at warehouses, and provide customers with accurate ETAs. The cost of the error is proportional to how many hours the prediction is off.
- When to Lean Towards Classification: The Need for Decision and Action
- Use Case: You are making a categorical decision, routing a process, or identifying a state.
- Scenario: A bank’s security system needs to flag fraudulent transactions. It doesn’t need to know “how fraudulent” a transaction is on a scale of 1-100; it needs a clear “Flag/Don’t Flag” decision. This binary outcome is perfect for classification, as it directly integrates with their automated fraud-review workflow.
- The Gray Area: Problem Framing is Everything
- The conclusion wisely notes that some problems can be framed either way. The choice becomes a strategic one.
- Example: Customer Churn
- Regression Framing: “What is the probability (0% to 100%) that this customer will churn?” This provides a continuous “risk score.” Marketing can then prioritize customers with a 90% risk over those with a 50% risk and design different interventions for each.
- Classification Framing: “Will this customer churn? (Yes/No)” This is simpler and directly answers the fundamental question. It’s useful for automated systems that simply offer a retention discount to everyone flagged as “Yes.”
- The Better Approach? Often, the regression-style (probability) output is more powerful because it contains more information. You can always convert a probability into a Yes/No decision by applying a threshold (e.g., if probability > 80%, then “Yes”), but you cannot recover the granularity from a simple Yes/No.
4. The Mark of a Proficient Practitioner: A Balanced Toolkit
Mastering both paradigms is non-negotiable for effectiveness in the field.
- Avoiding the “Hammer and Nail” Problem: A practitioner who only knows how to build classification models will try to force every business problem into a categorical box, even when a numerical prediction is what’s truly needed (and vice-versa).
- Strategic Tool Selection: The most effective data scientists and ML engineers are like skilled craftspeople. They don’t just know how to use their tools; they know which tool to pull out for which job. They listen to the business problem, understand the desired outcome and action, and then—and only then—select the appropriate modeling paradigm.
- Building Value: By correctly matching the technique (regression or classification) to the problem, you ensure that the model’s output is directly interpretable and actionable for stakeholders. This alignment between technical output and business need is what separates academic exercises from solutions that deliver genuine, measurable value.
In essence, the distinction between regression and classification is the first and most important filter through which any machine learning problem must pass. Getting this fundamental choice right sets the stage for a successful project, while getting it wrong dooms it to irrelevance or failure, no matter how sophisticated the subsequent modeling becomes.