Introduction: The Evolving Landscape of Business Analytics Platforms
Business analytics has become the cornerstone of data-driven decision-making in modern organizations, with platforms like Power BI and Tableau leading the transformation of raw data into actionable insights. As we navigate through 2025, the business analytics landscape has evolved dramatically, with these platforms expanding beyond traditional visualization tools into comprehensive analytics ecosystems that incorporate AI capabilities, advanced data modeling, and collaborative features. The global business analytics market, valued at $81.5 billion in 2023, is projected to reach $133.8 billion by 2027, reflecting the growing recognition that effective data analysis is no longer a luxury but a strategic necessity for competitive advantage.
The choice between Power BI and Tableau represents one of the most significant decisions organizations face when building their business analytics capabilities. Both platforms have matured considerably, with Microsoft’s Power BI leveraging its deep integration with the Microsoft ecosystem and Tableau maintaining its position as the gold standard for data visualization excellence. In 2025, this decision is no longer simply about which tool creates the prettiest charts, but which platform provides the most comprehensive solution for an organization’s specific data culture, technical requirements, and strategic objectives.
This comprehensive comparison examines Power BI and Tableau across multiple dimensions critical for business analytics success in 2025. We’ll explore their respective strengths in data connectivity, visualization capabilities, AI integration, pricing structures, collaboration features, and scalability. More importantly, we’ll provide a framework for evaluating which platform aligns best with different organizational contexts, from small businesses taking their first steps in business analytics to enterprises managing complex, global analytics deployments. Understanding these nuances ensures that organizations select not just the best tool, but the right partner for their business analytics journey.
Platform Architecture and Core Capabilities
Power BI: The Microsoft Ecosystem Integrator
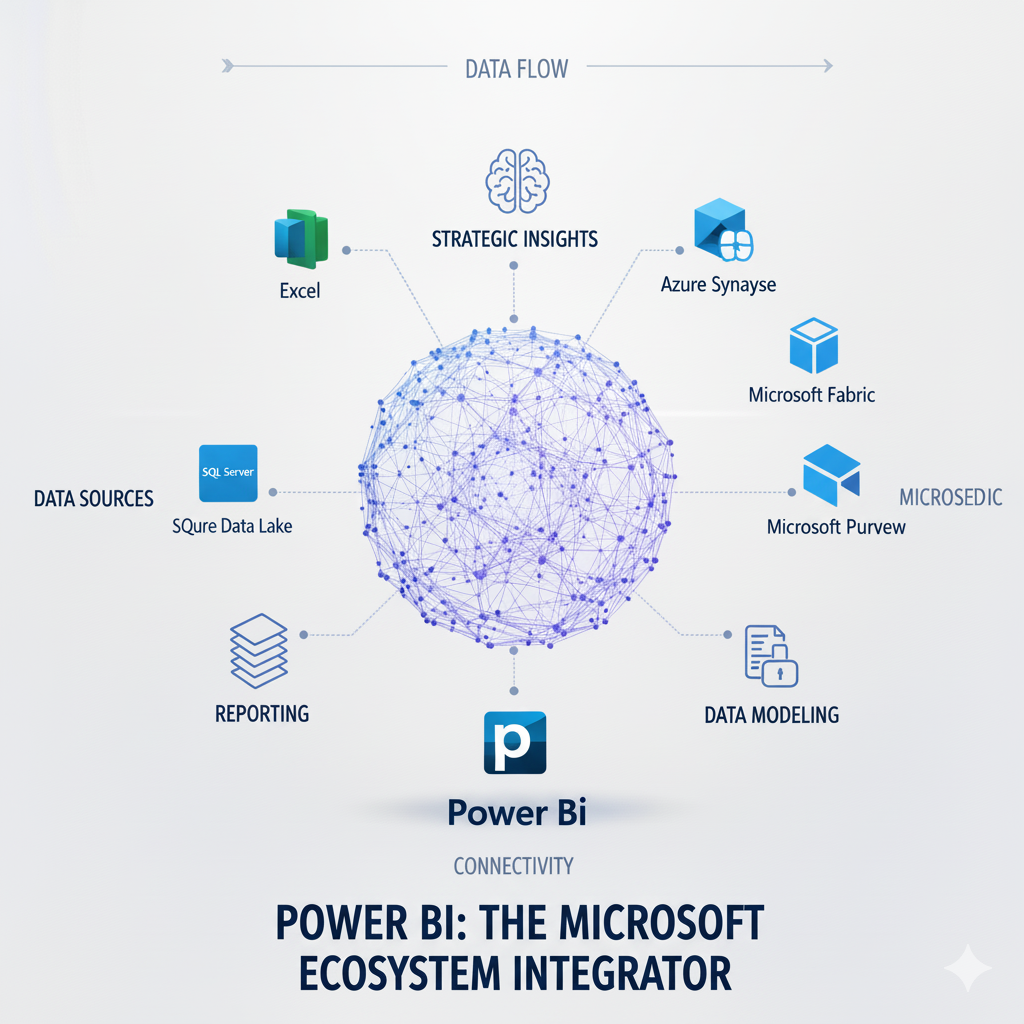
Power BI has evolved from a standalone visualization tool into a comprehensive business analytics platform deeply integrated with the broader Microsoft ecosystem. At its core, Power BI follows a three-tier architecture consisting of Power BI Desktop for report creation, the Power BI Service for sharing and collaboration, and Power BI Mobile for consumption on mobile devices. This architecture enables a seamless workflow from data preparation to insight consumption, with each component optimized for its specific role in the business analytics lifecycle.
The fundamental strength of Power BI lies in its native integration with Microsoft’s product suite. Azure Data Services provide scalable cloud data storage and processing, Microsoft 365 enables natural collaboration through familiar tools like Teams and SharePoint, and Dynamics 365 offers pre-built connectors for CRM and ERP data. This integration creates a cohesive business analytics environment where data flows naturally between operational systems and analytical tools, reducing integration complexity and technical barriers. For organizations already invested in the Microsoft ecosystem, this represents a significant advantage in implementation speed and total cost of ownership.
Power BI’s data modeling capabilities have matured significantly, with the Power Query engine providing robust data transformation capabilities and DAX (Data Analysis Expressions) offering a powerful formula language for creating complex calculations and business logic. The recent introduction of DirectQuery for Power BI datasets enables composite models that combine import and direct query modes, while Aggregations allow organizations to work with massive datasets by automatically selecting the appropriate level of detail for each analysis. These capabilities make Power BI particularly strong for organizations requiring complex data modeling and calculation logic in their business analytics implementations.
Tableau: The Visualization Specialist Evolved
Tableau maintains its position as the visualization leader in the business analytics space, but has expanded its capabilities to become a more comprehensive analytics platform. The Tableau architecture consists of Tableau Desktop for authoring, Tableau Server or Tableau Online for sharing and governance, and Tableau Mobile for consumption. Underpinning this architecture is Tableau’s VizQL technology, which translates drag-and-drop actions into data queries and automatically visualizes the results, making sophisticated analytics accessible to non-technical users.
Tableau’s core strength remains its unparalleled data visualization capabilities. The platform offers an extensive library of visualization types, sophisticated formatting options, and intuitive interactivity features that enable users to create highly engaging and informative dashboards. Recent advancements in Tableau’s Explain Data use AI to automatically generate explanations for outliers and patterns, while Ask Data allows natural language querying of datasets. These features demonstrate Tableau’s commitment to making advanced analytics accessible while maintaining its visualization excellence.
The Tableau data engine has evolved to handle increasingly complex business analytics scenarios. The introduction of Hyper as Tableau’s in-memory data engine technology significantly improved data processing speed, while Tableau Prep addressed the data preparation gap that was historically a weakness compared to Power BI. Tableau’s approach to data modeling emphasizes flexibility and user-friendliness, with features like relationships (as opposed to rigid joins) allowing more dynamic exploration of connected data sources. This makes Tableau particularly strong for exploratory analysis and scenarios where business users need to combine and analyze data from multiple sources without extensive technical support.
Data Connectivity and Integration Capabilities
Power BI: The Enterprise Data Integrator
Power BI excels in environments with diverse and complex data sources, particularly within Microsoft-centric organizations. The platform offers extensive connectivity options through both built-in connectors and the ability to develop custom connectors using the Power Query SDK. With over 200 certified connectors available in 2025, Power BI can integrate with virtually any data source, from traditional databases and cloud services to real-time streaming data and big data platforms.
The depth of integration with Microsoft Azure services represents a significant advantage for organizations using Microsoft’s cloud platform. Azure Synapse Analytics integration enables direct querying of petabyte-scale data warehouses, Azure Data Lake Storage provides a unified data foundation for analytics, and Azure Analysis Services allows enterprise-scale semantic models to be shared across multiple Power BI reports. For real-time business analytics, Azure Stream Analytics integration enables dashboard updates from live data streams, while Power Automate connectivity allows the creation of automated workflows triggered by data insights.
Power BI’s dataflow capability enables reusable data preparation logic that can be shared across multiple reports and datasets. Dataflows leverage the same Power Query technology used in Power BI Desktop, allowing organizations to establish centralized data transformation rules that ensure consistency across their business analytics implementations. When combined with Azure Data Factory for orchestration, this creates a comprehensive data integration pipeline that spans from raw data ingestion to business-ready datasets, making Power BI particularly strong for organizations with complex data governance and transformation requirements.
Tableau: The Flexible Data Explorer
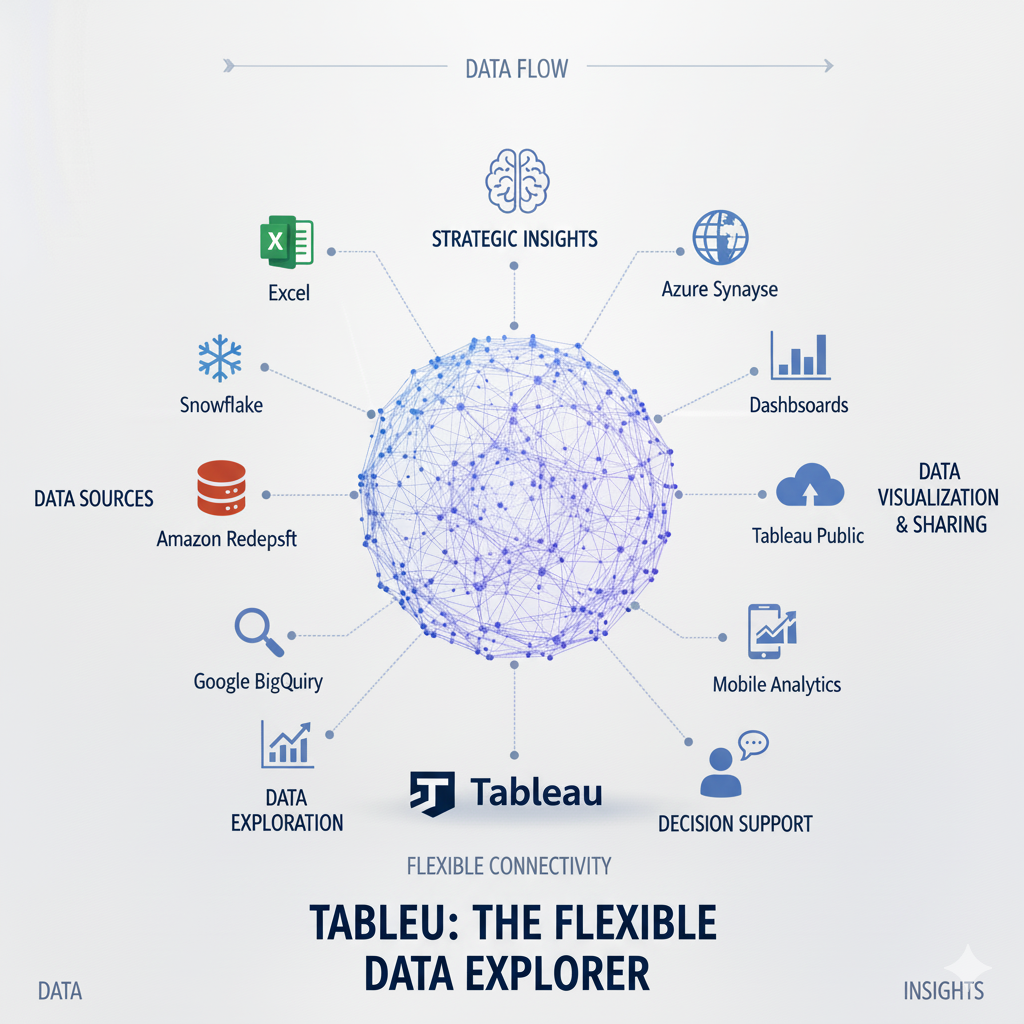
Tableau approaches data connectivity with a focus on flexibility and user autonomy, enabling business users to connect to and combine data from multiple sources with minimal IT intervention. The platform supports a wide range of data connectors, including traditional databases, cloud applications, big data platforms, and file-based data sources. Tableau’s Web Data Connector framework allows organizations to build custom connectors for proprietary or niche data sources, further expanding its connectivity options.
Tableau’s strength in data blending enables users to combine data from multiple sources without requiring pre-built data warehouses or complex ETL processes. The data interpreter feature automatically cleans and structures data from imperfect sources like Excel files and PDFs, while cross-database joins allow relationships between tables from different database technologies. For advanced business analytics scenarios, Tableau’s Hyper engine can handle large datasets efficiently, and extract-based approaches allow users to work with snapshots of live data for improved performance.
The integration with Tableau Catalog provides comprehensive data discovery and governance capabilities, helping organizations understand what data is available, where it comes from, how it’s being used, and by whom. This is particularly valuable for large enterprises with complex data environments and strict compliance requirements. Tableau’s Prep Conductor enables scheduling and monitoring of data preparation flows, bringing enterprise-grade automation to what was traditionally a manual process. These capabilities make Tableau particularly strong for organizations with diverse data sources and a culture of business-led business analytics.
Visualization and User Experience Comparison
Power BI: The Business User’s Analytics Companion
Power BI has made significant strides in visualization capabilities, balancing ease of use with analytical depth. The platform offers a comprehensive set of built-in visualizations that cover most common business analytics scenarios, from basic bar charts and line graphs to more advanced visuals like decomposition trees and key influencers. The Power BI visuals marketplace provides access to hundreds of custom visuals developed by Microsoft and third parties, enabling organizations to extend the platform’s capabilities for specific use cases.
The user experience in Power BI is designed to be accessible to users with varying levels of technical expertise. The Quick Insights feature uses machine learning to automatically find patterns and outliers in data, while the Q&A natural language interface allows users to ask questions about their data in plain English. Recent enhancements in Power BI’s conditional formatting and theming capabilities enable the creation of consistently branded and professional-looking reports without requiring design expertise. These features make Power BI particularly approachable for organizations with less technical business users.
For advanced analytics, Power BI integrates with Azure Machine Learning and supports R and Python visuals, allowing data scientists to incorporate custom analyses directly into business reports. The AI visuals include text analytics, image detection, and forecasting capabilities that bring advanced analytics within reach of business users. Power BI’s strength lies in making these sophisticated capabilities accessible through an intuitive interface, bridging the gap between technical data science and business decision-making in business analytics.
Tableau: The Visualization Powerhouse
Tableau remains the undisputed leader in data visualization, with capabilities that enable the creation of highly sophisticated and interactive dashboards. The platform’s drag-and-drop interface makes complex visualizations accessible, while its extensive formatting options give designers precise control over every aspect of the user experience. Tableau’s Show Me feature recommends appropriate visualizations based on selected data fields, helping users choose the most effective way to present their insights.
The depth of Tableau’s visualization capabilities is particularly evident in its handling of geographic and statistical visualizations. Built-in spatial analytics support complex mapping scenarios, while advanced chart types like box plots, bullet graphs, and Gantt charts enable sophisticated statistical and project management reporting. Tableau’s parameter controls allow users to create highly interactive dashboards where viewers can adjust inputs and immediately see updated results, facilitating exploratory analysis and what-if scenarios.
Tableau’s recent investments in ** augmented analytics** have further strengthened its position. Ask Data allows natural language querying of datasets, Explain Data automatically generates statistical explanations for data points, and Model Builder helps users build and interpret predictive models without coding. These capabilities demonstrate Tableau’s evolution from a visualization tool to a comprehensive business analytics platform while maintaining its core strength in creating engaging, insightful data experiences.
AI and Advanced Analytics Capabilities
Power BI: AI Democratization Through Microsoft Integration
Power BI leverages Microsoft’s substantial investments in artificial intelligence to bring advanced analytics capabilities within reach of business users. The platform’s AI visuals include automated time-series forecasting, text analytics for sentiment analysis and key phrase extraction, and image recognition for categorizing visual content. These capabilities are accessible through simple point-and-click interfaces, requiring no coding or data science expertise, which accelerates the adoption of AI in business analytics.
The integration with Azure Machine Learning enables organizations to operationalize custom machine learning models within their Power BI reports. Business users can consume predictions from models trained in Azure ML directly within their dashboards, while data scientists can monitor model performance and retrain models based on business feedback. This creates a virtuous cycle where business analytics informs model development and improved models enhance business insights. For organizations already using Azure ML, this integration represents a significant competitive advantage.
Power BI’s cognitive services integration brings pre-built AI capabilities to data preparation through Power Query. Users can apply text translation, sentiment analysis, and image tagging during data transformation, enriching datasets with AI-derived insights before visualization. The AI Insights feature in Power BI Dataflows enables the creation of AI-enriched datasets that can be shared across multiple reports. These capabilities make Power BI particularly strong for organizations looking to scale AI across their business analytics initiatives without requiring extensive data science resources.
Tableau: Embedded Advanced Analytics
Tableau has integrated advanced analytics capabilities directly into its core platform, making statistical functions and predictive modeling accessible through intuitive interfaces. The platform includes built-in ** trend lines**, forecasting, and cluster analysis that users can apply with a few clicks, with automatic explanations of the statistical methods and assumptions behind each analysis. This approach demystifies advanced analytics and encourages exploration without requiring statistical expertise.
The integration with Tableau’s Einstein Discovery brings predictive modeling capabilities to business users through a point-and-click interface. Users can build, validate, and deploy predictive models directly within Tableau, with automatic generation of explanations that help business stakeholders understand and trust the predictions. Einstein Discovery can suggest the most impactful predictors for a target variable and generate natural language explanations of model results, making predictive analytics more accessible for business analytics users.
For organizations with existing data science teams, Tableau supports integration with external analytics platforms through TabPy (for Python integration) and RServe (for R integration). This allows data scientists to incorporate custom analyses and visualizations into Tableau dashboards, bridging the gap between specialized analytics and business reporting. Tableau’s approach to advanced analytics emphasizes transparency and explainability, which is particularly important for regulated industries and scenarios where model decisions have significant business consequences.
Pricing and Total Cost of Ownership

Power BI: The Cost-Effective Enterprise Solution
Power BI offers a pricing structure that provides excellent value, particularly for organizations already invested in the Microsoft ecosystem. Business analytics The platform is available in several tiers, with Power BI Pro priced at $10 per user per month providing core reporting and sharing capabilities, and Power BI Premium offering enhanced performance and larger capacity at $20 per user per month or through capacity-based pricing starting at $4,995 per month. This tiered approach allows organizations to match their licensing to their actual usage patterns and requirements.
The most significant cost advantage for many organizations comes from Microsoft 365 integration. Organizations with Microsoft 365 E5 licenses already include Power BI Pro, effectively making the platform free for these users. Similarly, certain Dynamics 365 and Power Apps plans include Power BI capabilities. This bundling can result in substantial cost savings compared to purchasing standalone business analytics tools, particularly for enterprises with existing Microsoft investments.
The total cost of ownership for Power BI extends beyond licensing to include implementation, training, and maintenance costs. Power BI generally has lower training costs due to its familiar Microsoft interface and integration with Excel, which many business users already understand. The platform’s self-service capabilities can reduce the burden on IT teams, while its cloud-based nature eliminates hardware and maintenance costs associated with on-premises solutions. These factors make Power BI particularly cost-effective for mid-sized organizations and enterprises with broad user bases.
Tableau: The Premium Analytics Investment
Tableau positions itself as a premium business analytics solution with pricing that reflects its advanced capabilities and market leadership in visualization. The platform offers several licensing options, with Tableau Creator priced at $70 per user per month including Tableau Desktop, Prep, and a license for Tableau Server or Online. Tableau Explorer at $42 per user per month provides content exploration and self-service capabilities, while Tableau Viewer at $15 per user per month offers read-only access to published content.
Tableau’s pricing structure is designed to support a centralized content creation model where a smaller number of Creators develop content for a larger audience of Explorers and Viewers. This can be cost-effective for organizations with a clear separation between content creators and consumers, but may become expensive if many users need Creator capabilities. Tableau also offers Tableau Server for on-premises deployment and Tableau Online as a fully-hosted cloud option, with pricing based on users or cores depending on the deployment model.
The total cost of ownership for Tableau includes not just licensing but also implementation services, training, and potential integration costs. Tableau generally requires more extensive training than Power BI, particularly for advanced capabilities, and may involve higher consulting costs for complex implementations. However, business analytics Tableau’s strength in user adoption and analytics maturity can deliver substantial business value that justifies the higher initial investment, particularly for organizations where data visualization and exploration are central to their business analytics strategy.
Collaboration and Governance Features
Power BI: Integrated Microsoft Collaboration
Power BI leverages the Microsoft ecosystem to provide seamless collaboration capabilities that feel familiar to users of Microsoft 365. The Power BI Service enables sharing of reports and dashboards with colleagues, with granular permissions controlling who can view, edit, or share content. Integration with Microsoft Teams allows users to embed Power BI reports directly into team channels, bringing data into everyday conversations and decision-making processes.
The platform’s governance capabilities are particularly strong for enterprise deployments. Power BI Premium includes features like deployment pipelines for managing content across development, testing, and production environments, and XMLA endpoints that enable enterprise tools to manage Power BI datasets as they would any other Analysis Services database. Sensitivity labels from Microsoft Information Protection can be applied to Power BI content, ensuring consistent data protection policies across the Microsoft ecosystem.
Power BI’s data lineage view provides visibility into how datasets, reports, and dashboards are connected, helping organizations understand the impact of changes and maintain data quality. The Center of Excellence toolkit offers best practices and automation for managing Power BI at scale, while usage metrics help administrators understand how content is being consumed and where to focus training and support efforts. These features business analytics make Power BI particularly strong for large organizations with complex governance requirements.
Tableau: Purpose-Built Analytics Collaboration
Tableau provides collaboration features specifically designed for business analytics workflows. The platform enables users to subscribe to reports and dashboards, receiving regular updates via email when data refreshes or when certain conditions are met. Tableau Comments allow discussions directly within the context of specific data points, capturing the conversation around insights where they’re discovered.
The Tableau Catalog provides comprehensive governance capabilities, automatically inventorying all data sources, workbooks, and metrics across the Tableau environment. Tableau Prep Conductor extends governance to data preparation workflows, providing lineage from raw data to published datasets. Tableau’s Data Management add-on offers enhanced capabilities like certified data sources that help users identify trusted datasets, and lineage tracking that shows how data flows through the organization.
Tableau’s Permissions system provides fine-grained control over who can access and modify content, with the ability to sync with Active Directory and other identity providers. The Tableau Mobile app offers a first-class experience for consuming analytics on smartphones and tablets, with offline capabilities that ensure users have access to insights even without connectivity. These collaboration and governance features make Tableau particularly strong for organizations with distributed teams and complex compliance requirements.
Implementation and Scalability Considerations
Power BI: Rapid Deployment at Scale
Power BI is designed for rapid implementation, particularly in organizations with existing Microsoft infrastructure. The platform’s cloud-first approach eliminates the need for complex hardware provisioning, while its integration with Azure Active Directory simplifies user management and security configuration. Many organizations can have Power BI operational within days, with business users creating their first reports within hours of access.
The scalability of Power BI is managed through a combination of Power BI Premium for dedicated capacity and Power BI Embedded for embedding analytics in custom applications. Power BI Premium provides guaranteed performance for large user bases and complex datasets, with the ability to scale up capacity as needs grow. The recent introduction of **Power BI Premium Gen2 offers improved auto-scaling and more consistent performance, making it suitable for enterprise-scale deployments.
Power BI’s approach to scalability extends to its data handling capabilities. The platform can connect to datasets ranging from small Excel files to massive Azure Synapse Analytics data warehouses, with Aggregations automatically optimizing queries for the best performance. Incremental refresh policies ensure that only changed data is processed during updates, reducing refresh times for large datasets. These capabilities make Power BI suitable for organizations of all sizes, from small businesses to global enterprises.
Tableau: Enterprise-Grade Scalability
Tableau is built for enterprise-scale deployments, with architecture that can support tens of thousands of users and massive datasets. The platform offers multiple deployment options, including Tableau Online as a fully-managed cloud service, Tableau Server for on-premises or cloud deployment, and Tableau Public for sharing data with the world. This flexibility allows organizations to choose the deployment model that best fits their security, compliance, and performance requirements.
Tableau’s scalability is achieved through a distributed architecture that separates different functions across multiple servers. The VizQL Server processes visualization requests, the Application Server handles metadata and permissions, the Repository stores configuration information, and the Data Engine processes queries. This separation allows organizations to scale each component independently based on usage patterns, optimizing resource utilization and performance.
For handling large datasets, Tableau offers several approaches. Extracts can pre-aggregate and compress data for improved performance, while Live Connections allow direct querying of source databases for real-time data. The Hyper data engine provides fast data ingestion and query performance, particularly for complex analytical queries. Tableau’s scalability makes it suitable for the largest enterprises, though it may require more careful planning and configuration than Power BI for optimal performance.
Industry-Specific Applications
Power BI: Microsoft Ecosystem Specialization
Power BI shines in industries with strong Microsoft presence or those requiring deep integration with operational systems. In manufacturing, Power BI integrates seamlessly with Dynamics 365 Supply Chain Management, providing real-time visibility into production metrics, inventory levels, and supply chain performance. The platform’s ability to combine IoT data from Azure IoT Hub with business data from ERP systems enables comprehensive operational intelligence.
In financial services, Power BI’s integration with Azure security services enables compliance with strict regulatory requirements, while its AI capabilities support fraud detection and risk modeling. The platform’s what-if parameters allow financial analysts to model different scenarios, and its row-level security ensures that users only see data appropriate to their role and permissions.
For healthcare organizations, Power BI can integrate with Azure API for FHIR (Fast Healthcare Interoperability Resources) to analyze electronic health records while maintaining HIPAA compliance. The platform’s geospatial capabilities support public health mapping and resource allocation, while its natural language Q&A makes analytics accessible to clinical staff without technical expertise.
Tableau: Cross-Industry Visualization Excellence
Tableau excels in industries where data exploration and sophisticated visualization are paramount. In retail and e-commerce, Tableau’s customer analytics capabilities help organizations understand shopping behavior, optimize merchandising, and personalize marketing. The platform’s ability to combine point-of-sale data, web analytics, and customer relationship management data provides a 360-degree view of the customer journey.
The healthcare and life sciences sector benefits from Tableau’s statistical capabilities and ability to handle complex hierarchical data. Healthcare organizations use Tableau for clinical outcome analysis, operational efficiency, and population health management. Tableau’s ** mapping capabilities** are particularly valuable for public health organizations tracking disease outbreaks and healthcare access.
In education, Tableau helps institutions analyze student performance, optimize resource allocation, and improve operational efficiency. The platform’s intuitive interface makes it accessible to administrative staff without technical backgrounds, while its advanced capabilities support institutional research and accreditation reporting.
Making the Right Choice for Your Organization
When to Choose Power BI
Power BI is the optimal choice for organizations that meet certain criteria. Microsoft-centric organizations with existing investments in Microsoft 365, Dynamics 365, or Azure will benefit from Power BI’s seamless integration and potential cost savings through bundled licensing. The platform is particularly strong for organizations prioritizing ** rapid implementation** and broad user adoption, as its familiar interface and Excel integration reduce training requirements and resistance to change.
Organizations with complex data modeling requirements will appreciate Power BI’s robust data preparation capabilities and powerful DAX language for creating sophisticated business logic. Similarly, companies focusing on operational analytics that require embedding analytics in business processes will benefit from Power BI’s integration with Power Apps and other Microsoft Power Platform tools.
Cost-conscious organizations,
particularly those with existing Microsoft enterprise agreements, will find Power BI provides excellent value. Small to mid-sized businesses often choose Power BI because it offers enterprise-grade capabilities at an accessible price point, with a gentle learning curve that enables quick time-to-value.
When to Choose Tableau
Tableau is the preferred choice for organizations with different priorities and characteristics. Companies where data visualization excellence is a competitive differentiator will benefit from Tableau’s superior visual design capabilities and interactive dashboard features. Organizations with a culture of data exploration and discovery will appreciate Tableau’s intuitive interface for ad-hoc analysis and its strength in handling diverse data sources.
Enterprises with complex scalability requirements and large, sophisticated user bases often choose Tableau for its proven ability to support thousands of users and massive datasets. Similarly, organizations in highly regulated industries may prefer Tableau for its robust governance capabilities and track record in environments with strict compliance requirements.
Companies with existing data science teams often select Tableau for its advanced analytics integration and statistical capabilities. Organizations prioritizing user experience and adoption may find Tableau’s engaging interface and mobile experience drives higher utilization and business impact, justifying the higher investment.
Hybrid Approaches and Coexistence Strategies
Many organizations find that a “best of both” approach delivers optimal results, using both Power BI and Tableau for different use cases. A common pattern involves using Power BI for operational reporting and standardized metrics, leveraging its integration with Microsoft systems and lower cost per user, while using Tableau for exploratory analysis and strategic dashboards where visualization excellence is critical.
Another approach involves using Tableau for data scientists and advanced analysts who need sophisticated visualization and statistical capabilities, while deploying Power BI for business users who need access to standardized reports and self-service analytics. This hybrid approach maximizes the strengths of each platform while controlling costs by matching tool capabilities to user needs.
Integration between the platforms is increasingly feasible, with the ability to embed Tableau visualizations in Power BI reports (and vice versa) and to use both tools against common data sources like Azure Synapse Analytics or Snowflake. This allows organizations to create a cohesive business analytics environment that leverages the unique strengths of each platform without creating data silos or redundant processes.
The Future of Business Analytics Platforms
Power BI’s Strategic Direction
Power BI continues to evolve as a central component of Microsoft’s broader data and AI strategy. The platform is increasingly positioned as the front-end for the Microsoft Data Cloud, providing a unified experience for analyzing data across Azure Data Services, Microsoft 365, and Dynamics 365. Upcoming developments focus on deeper AI integration, with capabilities like automated insight generation and natural language querying becoming more sophisticated and accessible.
Microsoft is investing heavily in ****Power BI’s performance and scalability**, particularly for large enterprises. Enhancements to Power BI Premium, improved data modeling capabilities, and better integration with Azure Synapse Analytics aim to position Power BI as a credible alternative to traditional enterprise BI platforms for the most demanding use cases.
The democratization of advanced analytics remains a key theme, with Microsoft working to make machine learning and predictive analytics accessible to business users through intuitive interfaces. Integration with the Microsoft Power Platform enables the creation of end-to-end business applications that combine data, analytics, and process automation in a cohesive user experience.
Tableau’s Evolution Under Salesforce
Since its acquisition by Salesforce, Tableau has been evolving to integrate more deeply with the Salesforce Customer 360 platform while maintaining its position as a standalone analytics leader. The integration with **Tableau CRM (formerly Einstein Analytics) brings together Tableau’s visualization strengths with Salesforce’s AI capabilities, creating a powerful platform for customer analytics.
Tableau is focusing on **augmented analytics to make advanced capabilities more accessible to business users. Features like Ask Data, Explain Data, and Model Builder are becoming more sophisticated, with natural language processing and automated insight generation reducing the barriers to advanced analytics.
The platform is also expanding its **data management capabilities to address enterprise requirements for governance, lineage, and data quality. Tableau’s acquisition of **Empirical Systems brought advanced statistical capabilities, while investments in **Hyper continue to improve performance for large datasets and complex queries.
Conclusion: Strategic Considerations for 2025 and Beyond
The choice between Power BI and Tableau in 2025 is no longer about which platform is objectively “better,” but which is better suited to an organization’s specific context, requirements, and strategic direction. Both platforms have matured into enterprise-grade business analytics solutions capable of supporting the most demanding use cases, but they approach analytics from different philosophies and excel in different scenarios.
Power BI represents the integrated ecosystem approach, offering excellent value, rapid implementation, and seamless integration with the Microsoft stack. It’s particularly strong for organizations prioritizing operational analytics, cost efficiency, and broad user adoption across business functions. The platform’s continuous innovation and Microsoft’s substantial R&D investments ensure it will remain a compelling choice for Microsoft-centric organizations.
Tableau embodies the visualization excellence approach, providing unparalleled design capabilities, intuitive exploration features, and proven scalability for large enterprises. It’s particularly valuable for organizations where data discovery and visual storytelling are competitive differentiators, and for users who need to analyze diverse data sources without extensive technical support.
The most successful organizations will approach this decision not as a one-time tool selection but as part of a broader business analytics strategy that considers people, processes, and data culture alongside technology. They may even choose to leverage both platforms for different use cases, recognizing that the diversity of analytical needs within a large organization often requires multiple tools with complementary strengths.
As we look toward the future of business analytics, several trends will influence both platforms: the increasing importance of augmented analytics that make AI accessible to business users, the growth of embedded analytics that integrate insights directly into business applications, and the need for democratized data access that empowers employees at all levels to make data-driven decisions. Regardless of which platform organizations choose, the ultimate measure of success will be their ability to transform data into actionable insights that drive better business outcomes.